Bollinger Bands Crypto Trading Bot: A Practical Setup Guide
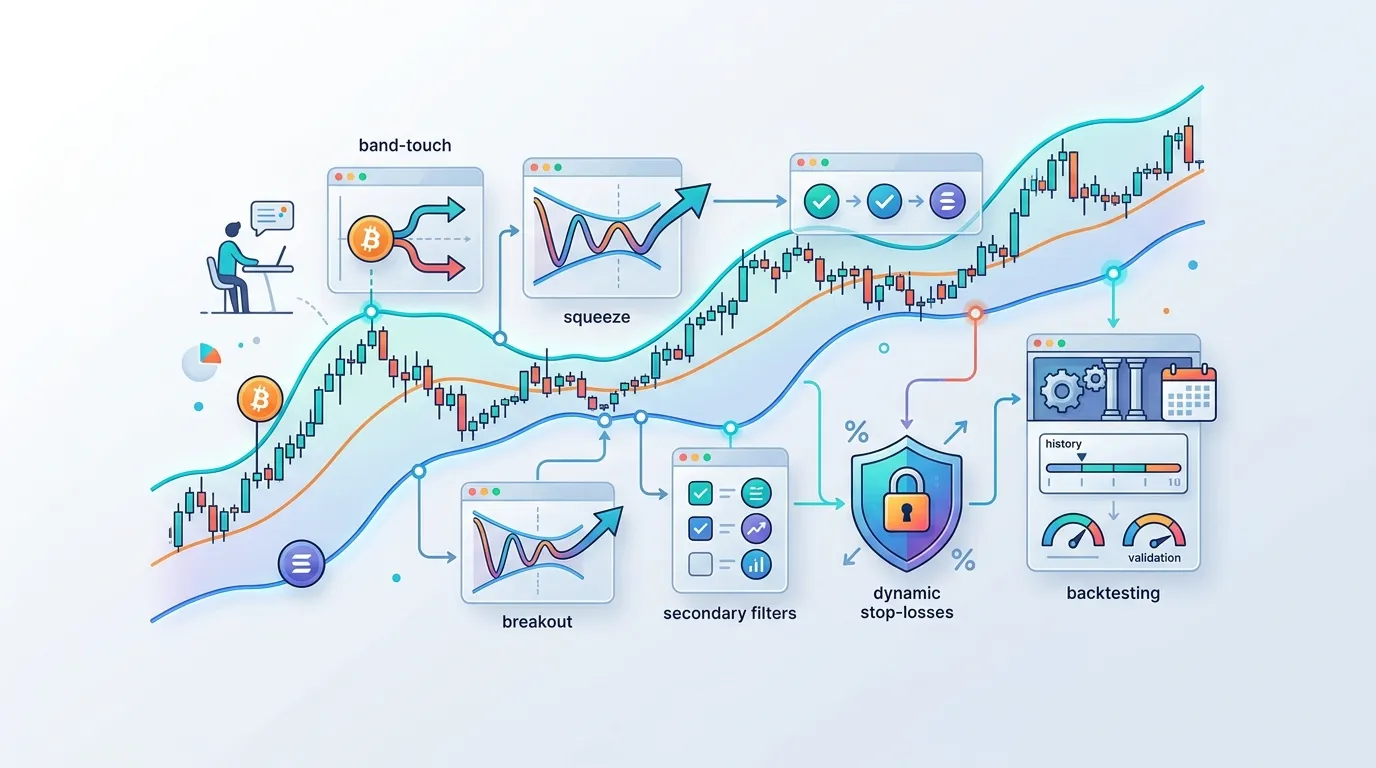
Volatility is the defining feature of crypto markets — and it's exactly what makes Bollinger Bands such a compelling core signal for automated bots. If you've tried to hand-code entry and exit logic that adapts to market conditions, you already know the problem: static thresholds go stale fast. This guide walks you through building a Bollinger Bands crypto trading bot from indicator fundamentals all the way to backtested, deployable logic — without hand-waving over the hard parts.
Quick answer: A Bollinger Bands crypto trading bot uses the distance between a moving average and its volatility-derived upper/lower bands to trigger entries and exits automatically. Band-touch signals target mean reversion; squeeze signals target momentum breakouts. Both approaches can be automated and refined through backtesting on historical candle data.
How Do Bollinger Bands Work in Crypto Trading?
Bollinger Bands consist of three lines plotted over price:
- Middle Band — a simple moving average (SMA), typically over 20 periods.
- Upper Band — the middle SMA plus N standard deviations of price (default: 2).
- Lower Band — the middle SMA minus N standard deviations.
Because standard deviation expands during high volatility and contracts during low volatility, the bands literally breathe with the market. When price touches the upper band, it has moved roughly 2 standard deviations above recent average price — statistically unusual. When it touches the lower band, the opposite is true.
In crypto markets, where 5–10% daily swings are routine, this self-adjusting quality is particularly valuable. A fixed overbought threshold of, say, $30,000 on BTC becomes meaningless the next week. A band that recalculates every candle does not.
The Two Primary Signal Patterns for a Bollinger Bands Bot
1. Band-Touch Mean Reversion
The core premise: price tends to revert toward the middle band after touching an outer band. A bot implementing this pattern would:
- Long entry: candle closes at or below the lower band, next candle opens above it → buy.
- Short / exit long: candle closes at or above the upper band → close position or open short.
- Take-profit target: the middle band (SMA), or the opposite outer band for aggressive targets.
This pattern works best in ranging, sideways markets where price oscillates between the bands without trending strongly in one direction.
2. Bandwidth Squeeze Breakout
A Bollinger Band squeeze occurs when the upper and lower bands converge — bandwidth narrows to a recent minimum, signaling that a large move is coming (though not which direction). A breakout bot would:
- Detect the squeeze: calculate Bandwidth = (Upper Band − Lower Band) / Middle Band. Flag when this value drops below a rolling 6-month low (or a fixed threshold you've backtested).
- Long entry: price breaks above the upper band after a squeeze.
- Short / exit long: price breaks below the lower band after a squeeze.
- Stop-loss: just inside the opposite band at the moment of entry.
Squeeze breakouts are momentum plays. They suit trending crypto markets and often capture the explosive moves that follow prolonged consolidation phases.
Choosing between mean-reversion and breakout logic isn't a matter of one being "better" — it's a matter of matching the pattern to current market regime, which is why many robust bots combine both with a regime filter.
Pairing Bollinger Bands With a Secondary Filter to Cut False Signals
Crypto markets generate plenty of noise. A band touch alone can precede a continued trend rather than a reversal. Adding a secondary filter before a signal fires dramatically reduces whipsaws.
Common filter options:
- RSI (Relative Strength Index): For a long entry on lower-band touch, require RSI < 35 (confirming oversold). For a short on upper-band touch, require RSI > 65. This ensures the band touch is backed by momentum exhaustion.
- Volume confirmation: Require that the breakout candle's volume exceeds the 20-period average volume by at least 1.5×. Low-volume breakouts fail far more often than high-volume ones.
- MACD histogram: A MACD histogram turning positive during a lower-band touch reinforces a long entry and filters band touches that occur during a strong downtrend.
A practical configuration for a mean-reversion bot on a 4-hour BTC/USDT chart might look like this:
| Parameter | Value |
|---|---|
| BB Period | 20 |
| BB Std Dev Multiplier | 2.0 |
| RSI Period | 14 |
| RSI Long Threshold | ≤ 35 |
| RSI Short Threshold | ≥ 65 |
| Volume Filter | ≥ 1.5× 20-period avg |
| Entry Trigger | Band close + RSI + volume all aligned |
How Accurate Are Bollinger Bands Signals for Crypto Markets?
No indicator produces perfectly accurate signals, and Bollinger Bands are no exception. In backtests on major crypto pairs (BTC, ETH) over trending periods, raw band-touch mean-reversion win rates typically land in the 45–60% range — which only becomes profitable with favorable risk-reward ratios. Adding RSI confirmation historically improves precision at the cost of signal frequency.
Squeeze breakout strategies tend to have lower win rates (often 40–55%) but higher average winners because they aim to capture large directional moves. The key metric isn't win rate alone — it's expectancy (average win × win rate − average loss × loss rate).
Important: past performance on historical data does not guarantee future results. Crypto markets shift regime frequently, and a parameter set that performed well on 2022 bear-market data may behave very differently in a bull cycle. Always validate across multiple market conditions.
Configuring Stop-Loss and Take-Profit Rules Around Band Width
Static stop-losses (e.g., always −2%) ignore the fact that a 2% move is trivial on a high-volatility day and catastrophic on a low-volatility one. Bollinger Band width gives you a built-in volatility gauge to make these rules dynamic.
Dynamic stop-loss formula:
Stop distance = (Upper Band − Lower Band) × 0.5
Stop price (long) = Entry price − Stop distance
This means your stop automatically widens when the market is volatile and tightens when it calms — keeping you in trades that have room to breathe and out of ones that turn immediately.
Take-profit tiers:
- First target (50% of position): middle band — fast, high-probability close.
- Second target (remaining 50%): opposite outer band — only reached if the full reversion plays out.
Using a tiered approach preserves some upside while locking in realized gains early, which is essential in crypto where reversals are sharp and fast.
What Is the Best Strategy for a Bollinger Bands Trading Bot?
There is no single "best" strategy — the right setup depends on the asset, timeframe, and market regime. That said, a well-regarded starting framework for a Bollinger Bands bot combines:
- 20-period SMA middle band, 2.0 standard deviations (the default, but always backtest alternatives like 2.5 for noisier assets).
- Mean-reversion entries on confirmed band touches (with RSI or volume filter).
- Squeeze detection as a mode-switch that disables mean-reversion and enables breakout logic.
- Dynamic stops pegged to band width.
- Position sizing capped at 1–2% of portfolio risk per trade — this is risk management, not indicator logic, but it's what keeps a strategy alive long enough to prove itself.
The most durable bot strategies are simple enough to understand completely and specific enough to backtest precisely. Complexity beyond what you can explain is complexity you can't debug.
How Do You Backtest a Bollinger Bands Bot Before Going Live?
Backtesting is the process of running your configured signal logic against historical OHLCV candle data to see how it would have performed. Here's a structured approach:
- Define your parameter grid. Test BB periods of 10, 20, and 50; std-dev multipliers of 1.5, 2.0, and 2.5. That's 9 combinations — each worth examining.
- Choose representative time windows. At minimum, test against a trending bull market, a prolonged bear market, and a sideways/ranging market. One year of data is a floor, not a ceiling.
- Key metrics to track: total return, max drawdown, Sharpe ratio, win rate, average winner vs. average loser, and number of trades (too few trades = statistically unreliable results).
- Walk-forward validation. After optimizing on a training window, test the winning parameters on an unseen out-of-sample window. If performance degrades dramatically, your parameters are overfit.
- Paper-trade before live capital. Run the optimized bot in a simulated environment for at least 2–4 weeks to catch edge cases your backtest data didn't include.
How Do You Build a Crypto Trading Bot Using Bollinger Bands?
What Programming Language Is Used to Create a Crypto Trading Bot?
Most crypto bots are written in Python — it has mature libraries like pandas, ta-lib, and ccxt that handle indicator math and exchange connectivity. JavaScript/Node.js is also common for event-driven architectures. However, writing, hosting, and maintaining bot code requires meaningful engineering effort alongside the trading logic.
For traders who want to focus on strategy rather than infrastructure, Cryptohopper.AI takes a different approach: you describe your Bollinger Bands bot in plain language — specifying the band-touch logic, secondary filters, stop-loss rules, and any other conditions — and the platform generates the working code, then auto-deploys and hosts it under a <project>.cryptohopper.app subdomain. Your Cryptohopper account connects via OAuth so the bot can operate within your existing trading setup. No server configuration, no dependency management, no manual deploy steps.
Can Bollinger Bands Be Used for Automated Cryptocurrency Trading?
Yes — and they're one of the more automation-friendly indicators because their signals are mathematically precise and unambiguous. A band touch is either confirmed or it isn't; bandwidth either crosses a threshold or it doesn't. That binary clarity makes them straightforward to encode into conditional logic that a bot can execute consistently, without the interpretation gaps that plague more subjective chart patterns.
The caveat: automated doesn't mean fire-and-forget. Crypto market regimes change, and a bot's parameters should be reviewed and revalidated periodically — especially after major structural shifts like a halving cycle or a significant regulatory event.
Wrapping Up
A Bollinger Bands crypto trading bot is one of the most structured ways to automate volatility-aware signal logic. The indicator's self-adjusting nature maps cleanly onto bot rules: band-touch entries, squeeze-breakout triggers, and band-width-scaled stops all express well as conditional logic. Add a secondary filter like RSI or volume, backtest across multiple market regimes, and validate out-of-sample before risking real capital. The math is accessible; the discipline is the hard part. Crypto trading involves substantial risk of loss — no indicator or strategy eliminates that.
Frequently asked questions
How do Bollinger Bands work in crypto trading?
Bollinger Bands plot three lines over price: a middle simple moving average (typically 20 periods) and upper/lower bands set 2 standard deviations above and below it. Because standard deviation expands during high volatility and contracts during low volatility, the bands self-adjust with market conditions — making them especially useful in crypto, where volatility swings frequently and dramatically.
What is the best strategy for a Bollinger Bands trading bot?
There is no single best strategy, but a robust starting framework combines mean-reversion entries on confirmed band touches (using RSI or volume as a secondary filter), a squeeze-detection mode that switches to breakout logic during low-bandwidth periods, and dynamic stop-losses pegged to current band width. Parameters like BB period (20) and standard-deviation multiplier (2.0) should always be validated through backtesting on your specific asset and timeframe.
How do you build a crypto trading bot using Bollinger Bands?
You can build one in Python using libraries like pandas, ta-lib, and ccxt to calculate the indicator, define entry/exit conditions, and connect to an exchange API. Alternatively, platforms like Cryptohopper.AI (https://www.cryptohopper.ai) let you describe the bot's logic in plain language and auto-generate, deploy, and host the working tool without writing or managing code yourself.
Can Bollinger Bands be used for automated cryptocurrency trading?
Yes. Bollinger Bands are well-suited to automation because their signals are mathematically unambiguous — a band touch or a bandwidth threshold crossing is either confirmed or it isn't, making it straightforward to encode into conditional bot logic. The caveat is that parameters should be backtested and periodically reviewed as crypto market regimes change.
How accurate are Bollinger Bands signals for crypto markets?
Raw band-touch mean-reversion signals typically show 45–60% win rates in backtests on major crypto pairs, while squeeze-breakout strategies often run 40–55% but with larger average winners. Adding a secondary filter like RSI confirmation generally improves precision at the cost of signal frequency. Win rate alone doesn't determine profitability — expectancy (average win × win rate minus average loss × loss rate) is the more meaningful metric. Past backtest performance does not guarantee future results.
Subscribe to the Cryptohopper newsletter
New posts, product updates, and the occasional lesson — straight to your inbox.
We'll never share your email. Unsubscribe anytime.
Related articles
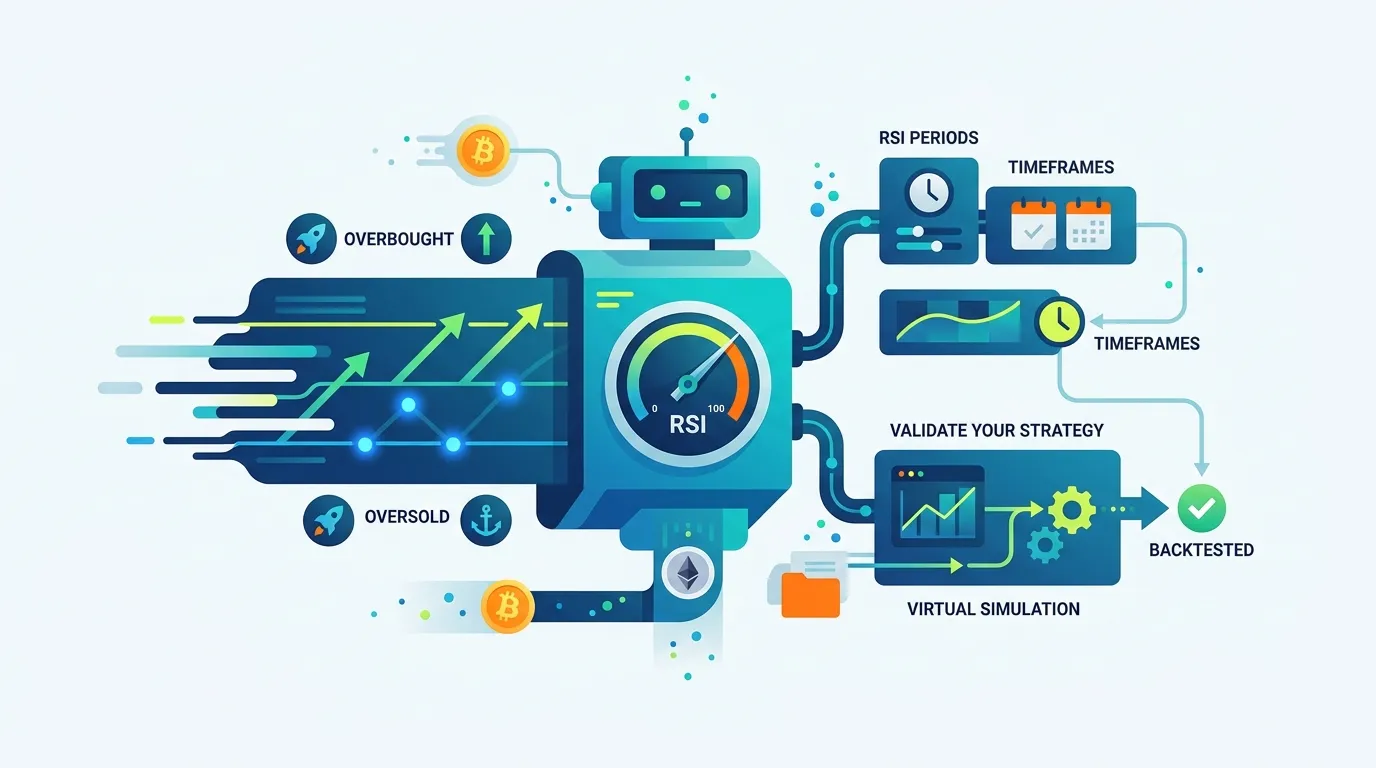
RSI Crypto Trading Bot: A Practical Build Guide
Learn how an RSI crypto trading bot detects overbought and oversold conditions, how to configure RSI periods and timeframes, and how to validate your strategy before going live.

DCA Crypto Trading Bot: How It Works and How to Build One
Learn how a DCA crypto trading bot automates dollar-cost averaging, how to configure intervals, order sizes, and safety orders, and how to build a custom DCA bot without writing code.

Bollinger Bands Crypto Trading Bot: A Complete Setup Guide
Learn how Bollinger Bands work, how to read squeeze and mean-reversion signals, and how to configure a Bollinger Bands crypto trading bot step by step — including backtesting and common mistakes to avoid.