Bollinger Bands Crypto Trading Bot: A Complete Setup Guide

Bollinger Bands have been a trader's volatility compass since John Bollinger introduced them in the 1980s — but configuring them inside an automated crypto bot is a different skill from reading them on a chart. If you've ever watched a band squeeze form on Bitcoin only to miss the breakout because your bot wasn't set up for it, this guide is for you. By the end, you'll understand how the indicator works, which signals are worth automating, and how to build a Bollinger Bands crypto trading bot without writing a single line of code from scratch.
How Do Bollinger Bands Work in Crypto Trading?
Bollinger Bands consist of three lines plotted on a price chart: a middle band (typically a 20-period Simple Moving Average), an upper band set 2 standard deviations above it, and a lower band set 2 standard deviations below. As volatility rises, the bands widen; as volatility compresses, they narrow. This dynamic width makes them uniquely useful for spotting both breakout setups and mean-reversion opportunities in crypto markets.
Because crypto markets can swing 10–20% in a single session, a fixed-width channel becomes useless fast. Bollinger Bands self-adjust: when BTC is grinding sideways, the bands tighten to hug price; when a news event detonates volatility, they expand immediately. That responsiveness is why they remain one of the most-used indicators in crypto bot configurations.
Understanding the Three Components
- Middle Band (SMA-20): Acts as the dynamic mean. Price tends to gravitate back toward it after extremes — this is the anchor for mean-reversion logic.
- Upper Band (SMA + 2σ): Statistically, price closes above this band only ~5% of the time under normal distribution. A touch here can signal overbought conditions or the start of a strong trend.
- Lower Band (SMA − 2σ): The mirror image. A close below it can signal oversold conditions or the beginning of a downtrend.
"Bollinger Bands don't tell you what price will do — they tell you where price is relative to its recent volatility history. The signal lies in how price interacts with those bands, not the touch alone."
Key Signals: Band Squeeze, Band Touch, and Mean Reversion
Three signal types dominate Bollinger-based bot strategies:
1. The Band Squeeze (Breakout Setup)
A squeeze occurs when the upper and lower bands converge to their narrowest point in a defined lookback window — commonly measured using the Bandwidth indicator (upper − lower) / middle. When Bandwidth falls to a 6-month low, the market is coiling. The direction of the subsequent breakout isn't guaranteed, which is why most bots add a confirmation filter (see the next section).
2. Upper/Lower Band Touch
A close at or beyond the upper band while the RSI is above 70 can signal an overextended rally. A close at or below the lower band while RSI is below 30 strengthens a potential long entry in a ranging market. Neither signal is reliable in isolation.
3. Mean Reversion to the Middle Band
After price pierces the lower band, many mean-reversion bots enter long with a target at the middle SMA-20 — a move of roughly 2–4% in a typical sideways BTC environment. The logic is probabilistic: extreme deviations from the mean tend to correct. This strategy historically underperforms during strong downtrends, so context matters.
Combining Bollinger Bands with RSI or MACD to Filter False Signals
Running Bollinger Bands alone produces a significant number of false entries — particularly in trending crypto markets where price "walks the band" for extended periods. Layering a second indicator slashes noise.
| Combination | What It Adds | Typical Use Case |
|---|---|---|
| Bollinger Bands + RSI | Momentum confirmation; avoids entries in overbought/oversold extremes during trends | Mean-reversion bots on ranging pairs |
| Bollinger Bands + MACD | Trend direction filter; MACD crossover confirms momentum shift | Breakout bots after a squeeze |
| Bollinger Bands + Volume | Validates breakout genuineness; low-volume squeezes often fake out | Breakout confirmation on 1H–4H timeframes |
| Bollinger Bands + EMA-200 | Filters trades to trend direction; avoids counter-trend longs in bear markets | Trend-following bots on daily charts |
A practical rule: only take lower-band long entries when MACD histogram is turning positive AND price is above the 200 EMA. This eliminates a large category of "catching falling knives" in sustained downtrends.
"Indicators work best as a committee. Bollinger Bands cast the vote; RSI or MACD count it."
Can You Automate a Trading Strategy Using Bollinger Bands?
Yes — Bollinger Band strategies are well-suited to automation because their signals are rules-based and quantifiable. Every condition (band touch, squeeze threshold, RSI filter level) can be expressed as an if/then statement that a bot can evaluate on every new candle close. The challenges are parameter selection, slippage, and ensuring the strategy behaves the same way in live conditions as it did in backtests.
How to Set Bollinger Band Parameters for Cryptocurrency Markets
The default 20-period / 2-standard-deviation setting was calibrated for equity daily charts in the 1980s. Crypto markets are more volatile and trade 24/7, so some adjustments are common:
- Period (length): Shorter periods (10–15) make bands more reactive and generate more signals — useful on 15-minute charts but noisier. Longer periods (30–50) smooth the bands for swing traders using daily candles.
- Standard deviation multiplier: Raising to 2.5 or 3 reduces the frequency of band touches, keeping only the most extreme events. Useful for markets like ETH that whipsaw often.
- Timeframe: 1-hour and 4-hour candles offer a reasonable balance between signal frequency and noise for most automated strategies. Daily candles are better for swing bots with multi-day holding periods.
- Bandwidth threshold for squeeze detection: Test multiple lookback windows (e.g., 125 candles vs. 250 candles) to define what "historically narrow" means for your specific trading pair.
Always derive these values from backtesting on the specific pair and timeframe you intend to trade — default parameters are a starting point, not an answer.
Step-by-Step: Building a Bollinger Bands Bot with Cryptohopper.AI
Cryptohopper.AI lets you describe your strategy in plain English, then generates and deploys the bot automatically on its cloud infrastructure — no manual deployment steps required.
Here is an example of how you might describe a mean-reversion Bollinger bot:
- Open Cryptohopper.AI at https://www.cryptohopper.ai and connect your Cryptohopper account via OAuth.
- Describe your bot in plain language. For example: "Build a mean-reversion bot for BTC/USDT on the 1-hour chart. Enter a long position when the closing price touches or crosses below the lower Bollinger Band (20-period SMA, 2 standard deviations) AND the RSI(14) is below 35. Exit when price reaches the middle band (SMA-20) or after a 3% gain, whichever comes first. Use a 1.5% stop-loss."
- Review the generated logic. The platform produces the bot code based on your description and deploys it automatically to a
<your-project>.cryptohopper.appsubdomain. No manual deploy button needed. - Refine iteratively. You can type follow-up instructions — "add a MACD confirmation filter" or "switch the timeframe to 4H" — and the platform regenerates and redeploys automatically.
- Connect exchange credentials securely. API keys are encrypted at rest using KMS and injected at runtime — they never appear in generated code or logs.
"Describing a strategy in plain language and having it become a running bot in minutes removes the biggest barrier most traders face: the code gap."
How to Backtest a Bollinger Strategy Before Going Live
Backtesting isn't optional — it's the only way to evaluate whether your chosen period, multiplier, and filter combination has a positive expectancy on your target pair.
Key steps for a rigorous backtest:
- Use at least 90 days of historical candle data; 6–12 months covers multiple market regimes (bull, bear, sideways).
- Test across different parameter combinations — a 20/2 and a 15/2.5 may produce dramatically different results on the same pair.
- Measure win rate, average win/loss ratio, maximum drawdown, and total trades — not just raw P&L, which can be dominated by a single lucky trade.
- Check whether most gains came from one brief market regime; if so, the strategy may be curve-fitted.
- Run a paper trading period of at least two weeks on live market data before deploying real capital. Slippage, fees, and exchange latency all affect live performance in ways backtests don't fully capture.
Crypto trading carries substantial risk of loss. Past backtest performance does not guarantee future results.
What Are the Risks of Using a Bollinger Bands Trading Bot?
Automation amplifies both the strengths and the weaknesses of your strategy. Common risks include:
- Trending markets punish mean-reversion bots. During a sustained BTC downtrend, buying every lower-band touch produces a sequence of losing trades.
- Over-optimised parameters. Tuning a 20/2 setting to a 17/2.3 because it performed better in a specific 30-day window is overfitting — it likely won't generalise.
- Ignoring fees and slippage. A strategy with a 0.8% average win looks great until you factor in a 0.1% taker fee each way.
- No trend context. Always know whether the overall market is trending or ranging before deploying a mean-reversion or a breakout variant.
- Skipping paper trading. Live market microstructure behaves differently from historical data. Paper trade first.
How Do Bollinger Bands Compare to Other Technical Indicators for Crypto Bots?
| Indicator | Volatility-Aware | Trend Direction | Mean Reversion | Complexity to Configure |
|---|---|---|---|---|
| Bollinger Bands | ✅ Yes | ❌ Needs filter | ✅ Strong | Low |
| RSI | ❌ No | ❌ No | ✅ Strong | Very Low |
| MACD | ❌ No | ✅ Yes | ⚠️ Weak | Low |
| ATR | ✅ Yes | ❌ No | ❌ No | Low |
| Ichimoku Cloud | ⚠️ Partial | ✅ Yes | ⚠️ Partial | High |
Bollinger Bands occupy a unique niche: they are the primary volatility-relative indicator that also delivers actionable entry zones. Pairing them with MACD for trend direction and RSI for momentum confirmation covers most of what a well-rounded entry signal needs.
What Is the Best Programming Language for Building a Crypto Trading Bot?
If you're writing a bot from scratch, Python is the dominant choice in the crypto space. Libraries like pandas, TA-Lib, and ccxt give you Bollinger Band calculations, candle data handling, and exchange connectivity in a mature ecosystem. JavaScript/TypeScript is a strong alternative if you prefer a Node.js stack. However, if your goal is to run a Bollinger strategy rather than to learn to code, AI-assisted platforms let you describe the logic and skip the language choice entirely.
Wrapping Up
Bollinger Bands give your trading bot a live read of volatility — and when combined with RSI or MACD, they form the backbone of both mean-reversion and breakout strategies. The key is disciplined parameter selection, honest backtesting across multiple market regimes, and a paper trading phase before going live. If you want to skip the code and go straight to the strategy, Cryptohopper.AI lets you describe your Bollinger bot in plain language and have it running in minutes — fully hosted, with your credentials secured and never exposed in generated code.
Frequently asked questions
How do Bollinger Bands work in crypto trading?
Bollinger Bands plot three lines around price: a 20-period Simple Moving Average in the middle, and upper and lower bands set 2 standard deviations away. As crypto volatility increases, the bands widen; as it compresses, they narrow. Traders use band touches for mean-reversion entries and band squeezes (when the bands converge) as potential breakout setups.
Can you automate a trading strategy using Bollinger Bands?
Yes. Bollinger Band strategies are well-suited to automation because all conditions — band touch, squeeze threshold, RSI filter level — can be expressed as clear if/then rules a bot evaluates on every candle close. The main challenges are selecting robust parameters, filtering false signals with a secondary indicator, and validating the strategy with thorough backtesting before deploying real capital.
What is the best programming language for building a crypto trading bot?
Python is the most widely used language for crypto bots due to mature libraries like TA-Lib (technical indicators), pandas (data handling), and ccxt (exchange connectivity). TypeScript/Node.js is a solid alternative. That said, AI-assisted builder platforms like Cryptohopper.AI let you describe your strategy in plain English and generate the bot automatically, removing the language choice as a barrier.
How do you set Bollinger Band parameters for cryptocurrency markets?
The classic default is a 20-period SMA with a 2 standard deviation multiplier. For crypto, shorter periods (10–15) make bands more reactive for intraday charts, while a higher multiplier (2.5–3) reduces noise on volatile pairs like ETH. Always derive your final settings by backtesting on the specific pair and timeframe you plan to trade — defaults are a starting point, not a solution.
What are the risks of using a Bollinger Bands trading bot?
Key risks include: mean-reversion bots losing repeatedly in trending markets; overfitting parameters to a short backtest window; ignoring exchange fees and slippage that erode small average wins; and deploying without a paper-trading phase. Crypto trading carries substantial risk of loss, and backtested results do not guarantee live performance. Always test rigorously and size positions conservatively.
Subscribe to the Cryptohopper newsletter
New posts, product updates, and the occasional lesson — straight to your inbox.
We'll never share your email. Unsubscribe anytime.
Related articles

RSI MACD Crypto Trading Bot: A Complete Setup Guide
Learn how RSI and MACD indicators work, how combining them filters false signals, and how to build, backtest, and tune a dual-indicator crypto trading bot using plain language and Cryptohopper.AI.
Bollinger Bands Crypto Trading Bot: A Practical Setup Guide
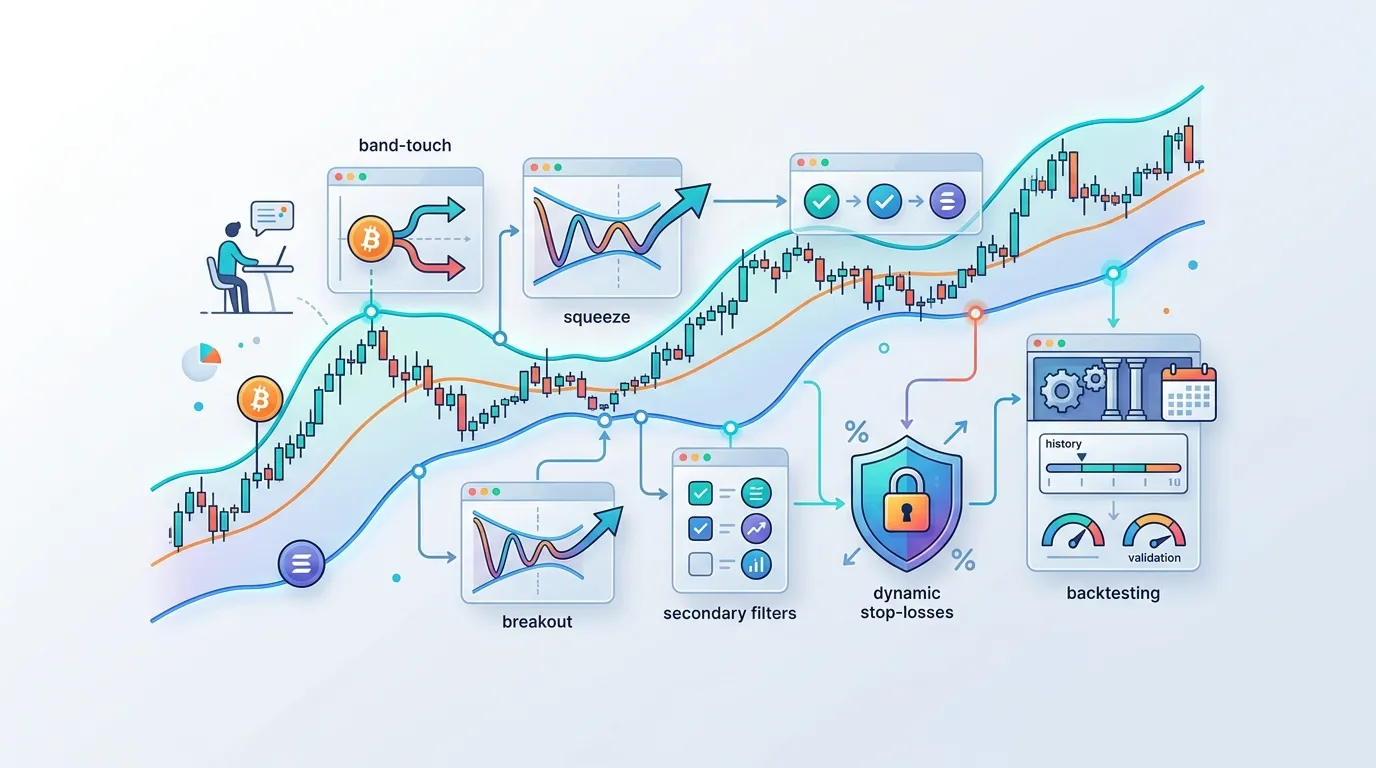
Learn how to configure a Bollinger Bands crypto trading bot with band-touch and squeeze-breakout logic, secondary filters, dynamic stop-losses, and backtesting to validate your setup before going live.

How to Build a Crypto Price Alert Bot That Monitors RSI and Bollinger Bands
Learn how to build a crypto price alert bot that monitors RSI overbought/oversold levels, Bollinger Band breakouts, and MACD changes — and fires real-time notifications before a trade signal is acted upon.