Crypto Trading Bot Signals: RSI, MACD & Bollinger Bands Guide

Most automated crypto trading strategies fail not because the indicators are wrong, but because they are used in isolation. A bot that fires on RSI alone will churn through dozens of false entries during a ranging market; one that relies solely on MACD crossovers will lag badly in fast-moving conditions. This guide explains exactly how crypto trading bot signals RSI MACD Bollinger Bands work individually, why layering them together is so powerful, and how to turn that multi-indicator logic into a working automated strategy — no coding required.
What Do RSI, MACD, and Bollinger Bands Actually Measure?
Understanding what each indicator measures — not just how to read it — is what separates a robust bot from a fragile one.
Relative Strength Index (RSI)
RSI is a momentum oscillator that compares the average size of recent gains to recent losses over a lookback period (default: 14 candles). The output is a value between 0 and 100.
- Above 70: the asset is considered overbought — price has risen faster than historical norms suggest is sustainable.
- Below 30: the asset is considered oversold — selling pressure has pushed price to an extreme.
- Middle band (40–60): momentum is neutral; trend signals are weaker here.
RSI does not tell you where price will go next; it tells you how stretched the current move is.
Moving Average Convergence Divergence (MACD)
MACD is a trend-following indicator derived from two exponential moving averages — typically the 12-period and 26-period EMAs. The MACD line is the difference between them. A 9-period EMA of the MACD line is called the Signal line.
- MACD crosses above Signal: bullish crossover — short-term momentum is accelerating upward.
- MACD crosses below Signal: bearish crossover — short-term momentum is declining.
- Histogram: the gap between MACD and Signal; growing bars indicate strengthening momentum.
MACD is a lagging indicator — it confirms a move that has already started, which makes it reliable but slow.
Bollinger Bands
Bollinger Bands consist of a 20-period simple moving average (middle band) flanked by two bands set 2 standard deviations above and below. Because they expand and contract with volatility, they do something the other two indicators cannot: they contextualise where price sits relative to recent volatility.
- Price touching the lower band: price is statistically extended to the downside — a potential mean-reversion zone.
- Price touching the upper band: the opposite — extended to the upside.
- Band squeeze (bands narrowing): volatility is contracting; a breakout in either direction is likely imminent.
"Bollinger Bands don't tell you direction — they tell you how unusual the current price level is. That is precisely why they pair so well with directional indicators like RSI and MACD."
How Do RSI, MACD, and Bollinger Bands Work Together in a Trading Bot?
When combined, these three indicators each contribute a different type of information: RSI supplies momentum context, MACD supplies trend direction, and Bollinger Bands supply volatility-adjusted price position. A bot using all three must satisfy conditions across all three dimensions before acting — this is called a confirmation-layer approach.
A straightforward long-entry rule looks like this:
- RSI < 35 — momentum is stretched to the downside (oversold pressure)
- MACD bullish crossover — the shorter EMA is reclaiming ground above the signal line (directional momentum shifting up)
- Price at or near the lower Bollinger Band — price is statistically extended relative to recent volatility
All three conditions must be true simultaneously before the bot places a buy order. Each condition acts as a filter that the others must pass through — significantly reducing the chance that any one noisy signal triggers a premature trade.
The short-entry (or exit) mirror rule: RSI > 65, MACD bearish crossover, price touching the upper Bollinger Band.
What Are the Best Indicator Combinations for Crypto Trading Bot Signals?
There is no universally "best" combination, but the RSI + MACD + Bollinger Bands trio is one of the most widely studied because the three indicators are largely non-redundant — they measure different things (momentum, trend, volatility) rather than doubling up on the same signal type.
| Indicator | Type | What It Adds | Main Weakness |
|---|---|---|---|
| RSI | Momentum oscillator | Identifies stretched price moves | Many false signals in trending markets |
| MACD | Trend-following | Confirms directional bias | Lags — enters after the move starts |
| Bollinger Bands | Volatility envelope | Places price in volatility context | Not directional on its own |
| RSI + MACD | Momentum + Trend | Filters trend-only false entries | Still ignores volatility context |
| RSI + MACD + BB | Momentum + Trend + Volatility | Full three-dimensional filter | Fewer signals; requires careful parameter tuning |
Pairing indicators that overlap (e.g., RSI + Stochastic RSI) is a common mistake — they measure almost the same thing, giving an illusion of confirmation without reducing noise.
How Do You Set RSI and MACD Parameters for a Crypto Trading Bot?
Default parameters (RSI 14, MACD 12/26/9, Bollinger Bands 20/2) are sensible starting points, but crypto's volatility often rewards tightening them.
RSI Period
- 9-period RSI: more responsive, generates more signals, higher noise — better for short-term bots on 1H–4H candles.
- 14-period RSI: the standard; balanced across most timeframes.
- 21-period RSI: smoother, fewer signals, more reliable for daily-candle swing bots.
MACD Settings
- The classic 12/26/9 works well on 4H and daily charts.
- For 1H charts, a faster setting like 8/21/5 reduces lag noticeably.
- Avoid going too fast (e.g., 3/10/1) — crossovers become so frequent the signal loses meaning.
Bollinger Bands
- The 20-period SMA with 2 standard deviations is the industry standard for a reason — it statistically captures ~95% of price action within the bands.
- Widening to 2.5 standard deviations makes band touches rarer and more significant, which suits lower-frequency bots.
What Is the Best Timeframe for Using RSI and MACD Signals in Crypto?
Timeframe selection is one of the most consequential decisions you will make for a bot's behaviour.
- 15-minute candles: high signal frequency, high noise. The RSI + MACD + BB combo can still work, but expect more false positives. Suited to scalping bots that manage risk tightly per trade.
- 1-hour candles: a practical middle ground for most retail crypto bots. Enough data points to reduce noise; fast enough to capture intraday swings.
- 4-hour candles: the most commonly recommended timeframe for swing-style bots using this indicator combination. Signal quality is higher; drawdowns between signals are more manageable.
- Daily candles: fewest signals, highest confidence per signal. Suited to position bots targeting multi-day moves.
"A bot that trades every 15 minutes and one that trades on daily candles can use identical indicator logic and produce completely different risk profiles. Timeframe is a strategy decision, not a technical one."
Can Bollinger Bands Improve the Accuracy of Automated Crypto Trading Signals?
Yes — and the mechanism is specific. Bollinger Bands act as a dynamic noise filter. Because the bands widen during high volatility and contract during low volatility, a price touch of the lower band during a volatile period is a much stronger signal than a touch during a quiet period. A bot that ignores this context will treat all RSI-oversold + MACD-crossover setups equally, even when the volatility environment makes some far less reliable.
Adding Bollinger Band confirmation to an RSI + MACD bot typically reduces total signal count by 30–50%, but improves the signal-to-noise ratio — meaning fewer trades, but a higher proportion that align with the intended setup.
How Do You Backtest a Crypto Trading Bot Using RSI, MACD, and Bollinger Bands?
Backtesting is the process of running your strategy's logic against historical price candles to see how it would have performed — before risking real capital.
A proper backtest for this three-indicator strategy should cover these steps:
- Select an asset and timeframe: choose a representative period (at least 6–12 months) that includes both trending and ranging market conditions.
- Define your entry and exit rules precisely: e.g., "Buy when RSI(14) < 35, MACD(12,26,9) line crosses above Signal, and closing price ≤ lower Bollinger Band(20,2). Exit when RSI > 65 or MACD crosses bearish."
- Log every signal fired: count total signals, winning trades, losing trades, average gain per trade, and maximum drawdown.
- Walk-forward testing: after optimising parameters on one historical window, test the resulting settings on a different window to check for overfitting.
- Check for look-ahead bias: ensure your backtest only uses data available at the moment the candle closes — peeking at future candles inflates results artificially.
- Stress-test on volatile periods: run the same logic over a period that includes a major crash or spike (e.g., a 40%+ drawdown period). A strategy that only works in bull markets is not a strategy — it is luck.
Backtesting does not guarantee future performance. Markets change structure; parameters that worked over 2022–2023 data may underperform in 2025 conditions. Use backtesting to eliminate clearly bad configurations, not to predict profits.
Building a Multi-Indicator Signal Bot Without Writing Code
Once you have defined your RSI + MACD + Bollinger Bands logic, turning it into a running bot is the next challenge. Cryptohopper.AI lets you describe your strategy in plain language — specifying your indicator conditions, entry/exit rules, and timeframe — and generates the bot code automatically, deploying it to a live subdomain without you writing a single line. You can iterate on the logic by describing changes in plain language, and your Cryptohopper account credentials are connected via OAuth so the bot can operate within your existing setup securely.
Wrapping Up
RSI, MACD, and Bollinger Bands are individually useful but genuinely powerful when combined as confirmation layers in an automated bot. RSI surfaces momentum extremes, MACD validates the directional shift, and Bollinger Bands place that shift in a volatility context — together, they filter out a large share of the false signals that plague single-indicator bots. Define your rules precisely, choose a timeframe that matches your strategy's intended cadence, backtest rigorously across varied market conditions, and remember that no strategy eliminates risk — it only manages it.
Frequently asked questions
How do RSI, MACD, and Bollinger Bands work together in a trading bot?
Each indicator covers a different dimension: RSI measures momentum (how stretched a price move is), MACD measures trend direction (whether short-term momentum is accelerating up or down), and Bollinger Bands measure volatility context (how unusual the current price level is relative to recent history). A bot combines them as confirmation layers — for example, requiring RSI below 35, a MACD bullish crossover, and price at the lower Bollinger Band all at the same time before placing a buy order. Each condition filters out signals that the other two would allow through, significantly reducing false entries.
What are the best indicator combinations for crypto trading bot signals?
The RSI + MACD + Bollinger Bands combination is one of the most widely used because the three indicators are non-redundant — they measure momentum, trend direction, and volatility respectively. Pairing indicators that overlap (like RSI and Stochastic RSI) creates the illusion of confirmation without actually reducing noise. For most retail automated strategies, adding a fourth indicator rarely helps and often causes over-optimisation.
How do you set RSI and MACD parameters for a crypto trading bot?
Default settings — RSI 14, MACD 12/26/9 — are solid starting points for 4-hour or daily candles. For faster 1-hour charts, a shorter RSI period (9) and faster MACD (8/21/5) reduces lag. For lower-frequency swing bots, a longer RSI (21) and the standard MACD produce fewer but higher-quality signals. Always validate any parameter change with a backtest on historical data before running it live.
Can Bollinger Bands improve the accuracy of automated crypto trading signals?
Yes. Bollinger Bands act as a dynamic noise filter because they widen during high-volatility periods and contract during quiet ones. A price touch of the lower band during a volatile stretch carries more statistical weight than during a calm period. Adding Bollinger Band confirmation to an RSI + MACD bot typically reduces total signal count by 30–50%, but raises the proportion of signals that align with the intended setup.
What is the best timeframe for using RSI and MACD signals in crypto trading?
The 4-hour candle is the most commonly recommended timeframe for the RSI + MACD + Bollinger Bands combination in automated crypto trading — it produces enough signal frequency to stay active without the excessive noise of 15-minute charts. The 1-hour timeframe is a practical middle ground for intraday bots. Daily candles produce the fewest but most reliable signals, suited to longer-term position bots.
How do you backtest a crypto trading bot using RSI, MACD, and Bollinger Bands?
Define your exact entry and exit rules first (specific RSI levels, MACD crossover conditions, Bollinger Band touch criteria), then run those rules against at least 6–12 months of historical candle data that includes both trending and ranging conditions. Log total signals, win rate, average trade result, and maximum drawdown. Then perform walk-forward testing — optimise parameters on one historical window and validate them on a separate, unseen window — to check that your settings are not just curve-fitted to past data.
Subscribe to the Cryptohopper newsletter
New posts, product updates, and the occasional lesson — straight to your inbox.
We'll never share your email. Unsubscribe anytime.
Related articles
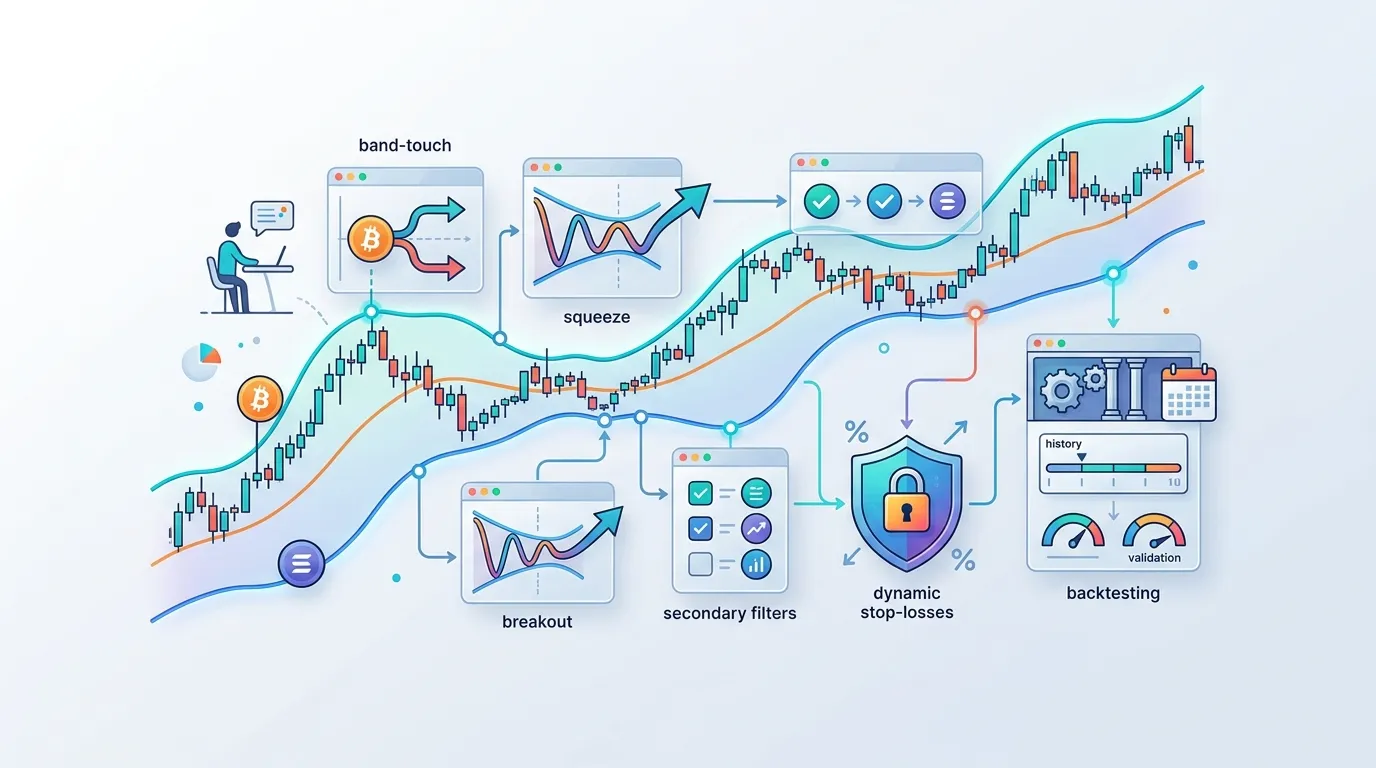
Bollinger Bands Crypto Trading Bot: A Practical Setup Guide
Learn how to configure a Bollinger Bands crypto trading bot with band-touch and squeeze-breakout logic, secondary filters, dynamic stop-losses, and backtesting to validate your setup before going live.
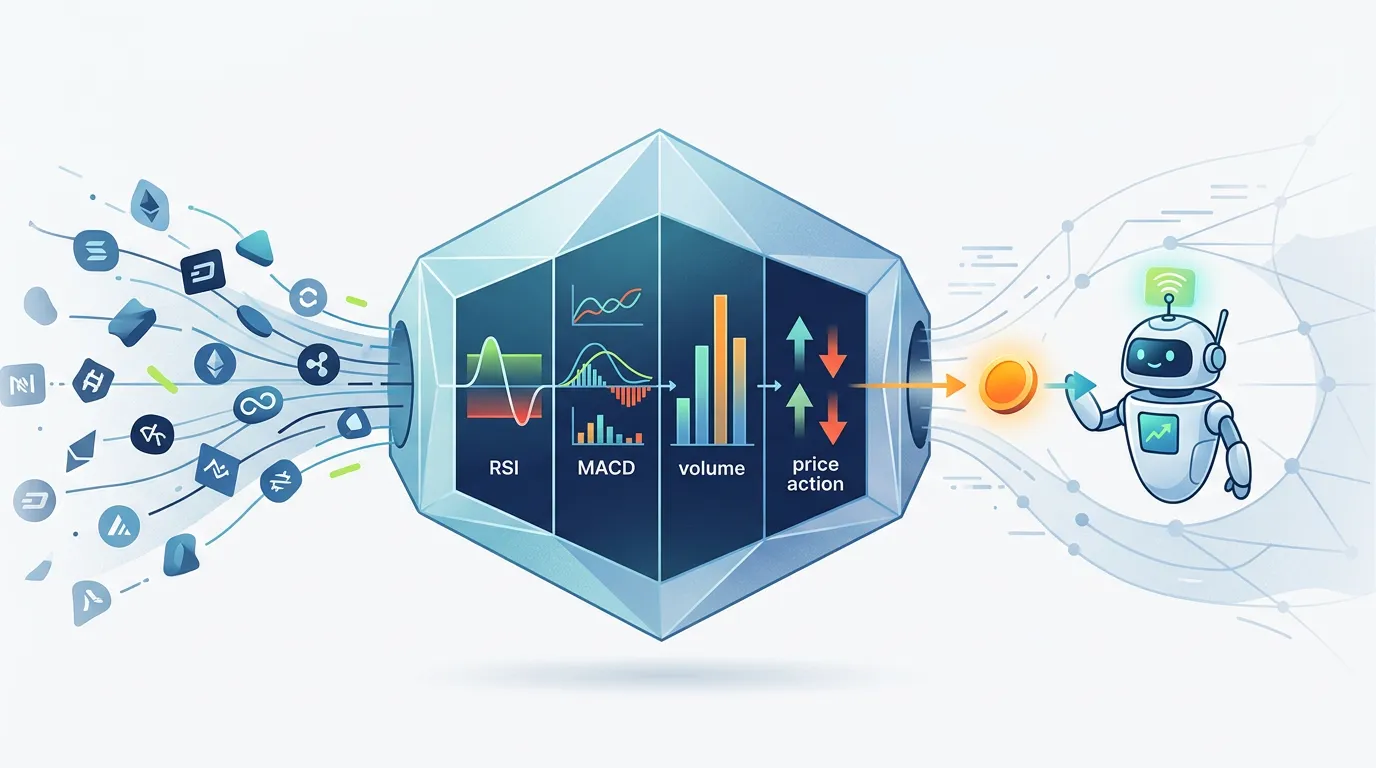
Crypto Market Screener for Trading Bots: A Practical Build Guide
Learn how to build a custom crypto market screener that filters assets by RSI, MACD, volume, and price action to surface clean bot entry signals before automated orders fire.
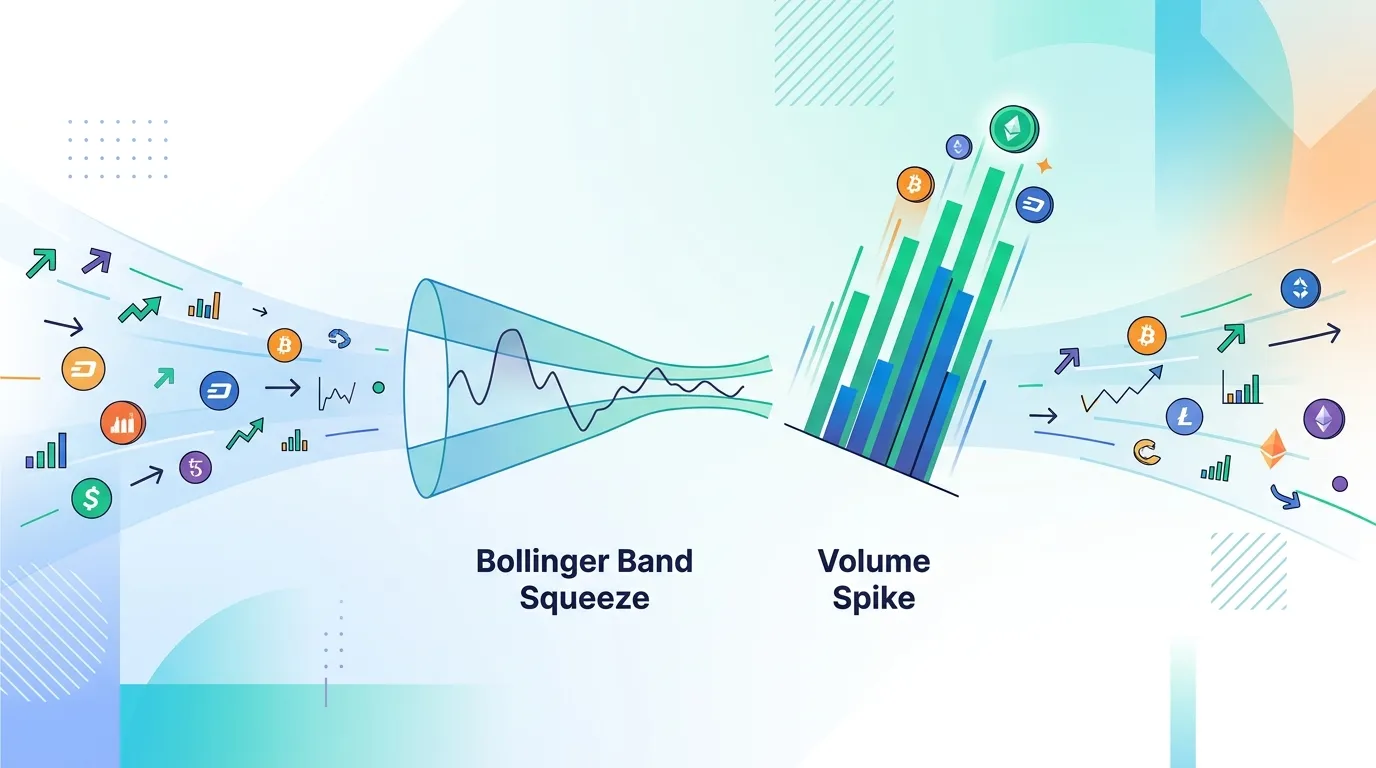
Crypto Market Screener Bot: Bollinger Band Squeeze & Volume Spike Guide
Learn how to build a crypto market screener bot that automatically surfaces high-probability setups by filtering coins on Bollinger Band squeezes and volume spikes.