Backtesting a Crypto Trading Bot Strategy: A Practical Guide

Deploying a crypto trading bot without testing its strategy first is like releasing software without QA — the market will find every flaw, and it will cost you. Backtesting gives you a structured way to pressure-test your logic before a single dollar is at stake. This guide walks you through what backtesting is, how to read the results, and how to avoid the traps that make backtests misleading.
Backtesting a crypto trading bot strategy means replaying the bot's entry and exit logic against historical OHLCV (Open, High, Low, Close, Volume) candle data to measure how the strategy would have performed over a chosen period. It produces quantitative metrics — win rate, drawdown, return — that help you decide whether a strategy is worth forward-testing on live markets.
What Is Backtesting and Why Does It Matter?
When you define a strategy — say, "buy when RSI crosses above 30 and sell when it crosses above 70 on a 4-hour BTC/USDT chart" — you are describing a set of rules. Backtesting applies those exact rules to every candle in a historical dataset and records what would have happened: when a trade opened, when it closed, and what the P&L looked like.
The value is simple: you can iterate on a strategy in minutes instead of months. Testing 12 months of price history takes seconds. Going live and waiting 12 months to see real results is obviously impractical.
That said, backtesting is a diagnostic tool, not a guarantee. Past price behavior does not repeat exactly, and markets evolve. Treat every backtest result as a hypothesis to be tested further, not a verdict.
"A backtest tells you how a strategy would have performed — not how it will perform. The distinction is everything."
Can You Backtest a Crypto Trading Bot Using Historical Data?
Yes — most serious backtesting tools consume OHLCV candle data exported from exchanges or third-party data providers. Each candle represents a time interval (1 minute, 15 minutes, 1 hour, 4 hours, 1 day) and records the open, high, low, close, and volume for that period. The bot's indicator calculations run on that candle series exactly as they would in live trading, generating simulated trade signals at each completed candle.
Quality of historical data matters. Gaps, incorrect timestamps, or data sourced from low-liquidity exchanges can skew results significantly. For major pairs like BTC/USDT or ETH/USDT, reputable exchange APIs and aggregators typically provide clean, deep historical datasets going back several years.
Key Metrics to Examine in Backtest Results
A raw P&L number alone is almost meaningless. These five metrics together paint a far more complete picture:
- Win Rate — The percentage of trades that close profitably. A 40% win rate can still be highly positive if the average win is significantly larger than the average loss (favorable risk/reward ratio).
- Maximum Drawdown — The largest peak-to-trough decline in portfolio value during the test period. This is arguably the most important risk metric. A strategy with a 60% max drawdown may be mathematically profitable but psychologically (and practically) unsustainable.
- Sharpe Ratio — Return per unit of risk, annualized. A Sharpe ratio above 1.0 is generally considered acceptable; above 2.0 is strong. It penalizes volatile equity curves even when total return looks attractive.
- Average Trade Duration — How long the bot typically holds a position. Short durations mean higher sensitivity to fees and slippage. Long durations mean less frequent compounding.
- Total Return — The overall percentage gain or loss across the test window. Always contextualize this against a simple buy-and-hold benchmark for the same asset and period.
What Are Common Mistakes to Avoid When Backtesting Crypto Strategies?
These three pitfalls account for the majority of backtests that look great in testing but fail in live markets:
Overfitting (Curve-Fitting)
Overfitting means tuning indicator parameters so precisely to historical data that the strategy has essentially memorized the past rather than learned a generalizable pattern. If RSI(14) gives mediocre results but RSI(7) with a specific entry threshold gives 200% returns, be skeptical — that precision is often noise. Validate by running the same parameters on an out-of-sample dataset the strategy was never tuned against.
Look-Ahead Bias
Look-ahead bias occurs when a backtest — accidentally or by design — uses information that would not have been available at the moment a trade signal was generated. A common example: using the close price of the signal candle to fill an order, when in practice the order would execute at the open of the next candle. Even a few ticks of artificial precision compound dramatically across hundreds of trades.
Ignoring Fees and Slippage
Exchanges charge maker/taker fees (typically 0.05%–0.2% per side). Slippage — the difference between the expected and actual fill price — adds further cost, especially on smaller or more volatile pairs. A backtest that ignores these can show a profitable strategy that is actually a loss-maker in live conditions. Always model realistic costs.
"If your strategy only works when fees are zero, it doesn't work."
How to Set Up Meaningful Test Parameters
Choose the Right Timeframe and Candle Interval
A strategy optimized on daily candles behaves very differently on 5-minute candles. Match the candle interval to the intended holding period and trading frequency of your bot. A swing-trading bot targeting multi-day moves has no business being tuned on 1-minute data.
Test over a window long enough to include multiple market regimes — a bull run, a bear market, and a sideways consolidation. A 6-month test that only captures a bull market flatters almost any long-bias strategy.
Indicator Settings: RSI, MACD, Bollinger Bands
- RSI (Relative Strength Index): Standard period is 14. Overbought/oversold thresholds of 70/30 are conventional starting points, not sacred values.
- MACD (Moving Average Convergence Divergence): Default settings are 12/26/9. Signal-line crossovers work differently in trending vs. ranging markets.
- Bollinger Bands: Default is 20-period SMA with ±2 standard deviations. Band width itself is a useful volatility proxy.
Start with default, well-understood settings, backtest, then adjust conservatively. Document every change and re-run on out-of-sample data.
How Do I Backtest a Crypto Trading Bot Strategy?
The process follows these steps:
- Define your strategy rules precisely — entry condition, exit condition, stop-loss, take-profit, and position size.
- Acquire clean historical OHLCV data for the asset and candle interval you want to test.
- Implement or configure the strategy logic in a backtesting environment (custom code, a dedicated backtesting library, or a platform tool).
- Set realistic cost assumptions — exchange fees, estimated slippage.
- Run the backtest and collect the full trade log alongside aggregate metrics.
- Validate on out-of-sample data — a separate date range the strategy was never tuned on.
- Proceed to paper trading before risking real capital.
What Is the Difference Between Backtesting and Paper Trading in Crypto?
Backtesting is historical simulation — you replay the past. Paper trading (also called forward-testing or simulation trading) runs your strategy against the live market in real time, generating signals and tracking hypothetical trades as prices unfold, but without executing real orders.
| Backtesting | Paper Trading | |
|---|---|---|
| Data used | Historical OHLCV | Live market feed |
| Speed | Instant (compress years into seconds) | Real-time only |
| Market impact | None (simulated) | None (simulated) |
| Fee/slippage modeling | Manual assumption | Closer to real fills |
| Detects look-ahead bias | Risk of bias | Not susceptible |
| Best for | Strategy exploration & optimization | Pre-live validation |
Paper trading is the critical bridge between a promising backtest and live deployment. It exposes issues that historical simulation cannot — such as API latency, order book depth at execution time, and your own behavioral response to real drawdowns (even when no real money is at stake).
"A strategy that survives both a rigorous backtest and a paper-trading period across different market conditions has earned a higher level of confidence — though never certainty."
What Is the Best Platform for Backtesting Crypto Trading Strategies?
The honest answer depends on your technical depth and what you are testing. Developers often reach for Python-based frameworks like Backtrader or Freqtrade for maximum flexibility. No-code and low-code platforms trade control for speed of iteration. What matters most is clean data, accurate fee modeling, and out-of-sample validation — regardless of the tool.
If you want to build a custom backtester tuned to your exact strategy logic, Cryptohopper.AI lets you describe the tool you want in plain language — candle interval, indicators, entry/exit rules, cost assumptions — and generates and auto-deploys the application for you, without manual configuration or infrastructure work. It is part of the AI builder the Cryptohopper team built on top of their established trading platform.
Wrapping Up
Backtesting a crypto trading bot strategy is not about finding a magic set of parameters that performed well in the past. It is about stress-testing your logic, understanding its failure modes, and building the discipline to validate rigorously before going live. Focus on drawdown as much as return, always model fees, guard against overfitting, and treat paper trading as a mandatory second step — not an optional one. The goal is to arrive at live trading with informed expectations, not false confidence.
Crypto trading involves substantial risk of loss. Backtest results do not guarantee future performance.
Frequently asked questions
How do I backtest a crypto trading bot strategy?
Define your strategy rules precisely (entry, exit, stop-loss, position size), acquire clean historical OHLCV candle data for your chosen asset and timeframe, run the logic through a backtesting environment with realistic fee and slippage assumptions, examine metrics like win rate, max drawdown, and Sharpe ratio, then validate on out-of-sample data before moving to paper trading.
How accurate is backtesting for crypto trading bots?
Backtesting accuracy depends heavily on data quality, cost modeling, and avoiding look-ahead bias. Even a well-constructed backtest is an approximation — it cannot replicate live order book conditions, API latency, or shifting market regimes. Treat results as directional evidence, not a precise forecast. Always follow up with paper trading on live market data.
What are common mistakes to avoid when backtesting crypto strategies?
The three most damaging mistakes are: overfitting (tuning parameters so tightly to historical data that the strategy fails to generalize), look-ahead bias (accidentally using price information that would not have been available at signal time), and ignoring trading fees and slippage (which can turn a paper-profitable strategy into a real-world loser).
What is the difference between backtesting and paper trading in crypto?
Backtesting replays your strategy against historical OHLCV data instantly, letting you test years of price action in seconds. Paper trading runs your strategy against a live market feed in real time, tracking hypothetical trades without real money. Paper trading is harder to game and exposes execution-level issues backtesting cannot, making it the essential next step before going live.
Can you backtest a crypto trading bot using historical data?
Yes. Most backtesting tools consume OHLCV (Open, High, Low, Close, Volume) candle data from exchanges or third-party providers. The bot's indicator calculations run on that candle series just as they would in live trading, generating simulated signals at each completed candle. Data quality is critical — gaps or inaccurate timestamps can significantly distort results.
Subscribe to the Cryptohopper newsletter
New posts, product updates, and the occasional lesson — straight to your inbox.
We'll never share your email. Unsubscribe anytime.
Related articles

Crypto Trading Bot Backtesting: A Step-by-Step Guide
Learn how to backtest a crypto trading strategy on historical candle data — from OHLCV inputs and key metrics to common pitfalls — before risking a single dollar of real capital.
RSI Crypto Trading Bot: A Practical Build Guide
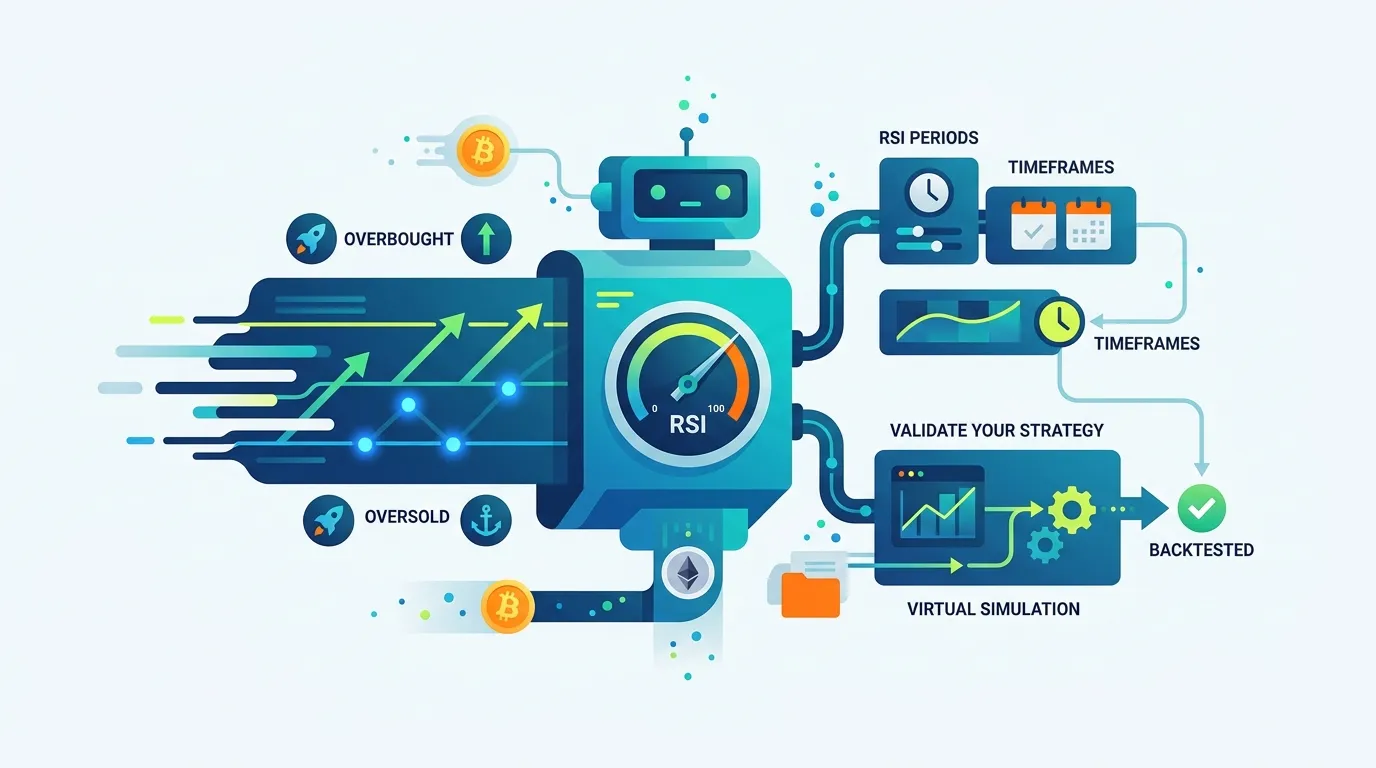
Learn how an RSI crypto trading bot detects overbought and oversold conditions, how to configure RSI periods and timeframes, and how to validate your strategy before going live.

MACD Crossover Crypto Trading Bot: A Complete Builder's Guide
Learn how to build a MACD crossover crypto trading bot that reads histogram momentum shifts to automate entries and exits — from signal logic to parameter tuning and backtesting.