Crypto Trading Bot P&L Dashboard: Build and Read It Like a Pro

If you're running automated crypto trading strategies, raw exchange balances tell you almost nothing useful. A purpose-built crypto trading bot P&L dashboard turns scattered trade data into a single, actionable view — showing you not just whether you're up or down, but why, and under which conditions your bot performs best. This guide walks through every metric that matters, how to interpret it, and how to build a real-time tracker you'll actually use.
What Metrics Should a Crypto Trading Bot P&L Dashboard Display?
A well-designed crypto trading bot P&L dashboard should display, at minimum: realized gains/losses, unrealized gains/losses, total return (%), maximum drawdown, win rate, risk/reward ratio, average entry price per open position, and exposure percentage. Adding daily and weekly P&L breakdowns lets you correlate performance with market conditions over time.
That's the direct answer — now let's unpack each one.
Realized vs. Unrealized Gains: Know the Difference
These two numbers are often shown side by side, but they represent fundamentally different things.
- Realized gains/losses are locked in. A trade is closed; the profit or loss is real and reflected in your account balance.
- Unrealized gains/losses (also called "open P&L") are floating — they move with price every second a position is open.
Treating unrealized gains as actual profit is one of the most common mistakes bot traders make. A position showing +18% can flip to –5% before the bot closes it.
Your dashboard should clearly separate the two and ideally show the total return as: (Realized P&L + Unrealized P&L) / Starting Capital × 100. Breaking this down by day and by week reveals seasonal patterns, weekend volatility effects, and how your bot behaves during major market events.
Why Maximum Drawdown Is Your Most Important Risk Signal
Maximum drawdown (MDD) measures the largest peak-to-trough decline in your portfolio's equity curve before a new peak is reached. If your account grew from $10,000 to $14,000 then fell to $9,800, the MDD is 30% — calculated from the peak of $14,000.
Here's why MDD matters more than raw profit for bot evaluation:
- It quantifies worst-case scenarios, not just average outcomes.
- It reveals leverage and position-sizing risk — a bot with high win rate but uncapped drawdown is dangerous.
- It helps you compare strategies fairly — a 20% return with a 5% MDD is far superior to a 20% return with a 40% MDD.
A common rule of thumb: if MDD exceeds 20–25% of your total capital, the strategy deserves serious review before scaling. Your dashboard should display MDD as both a percentage and a dollar figure, updated in real time as positions move.
Win Rate and Risk/Reward Ratio: The Full Picture of Strategy Health
Win rate is the percentage of trades closed in profit: Winning Trades / Total Trades × 100. It's intuitive but incomplete on its own.
Consider two bots:
- Bot A: 70% win rate, average win $30, average loss $90 → net negative over time
- Bot B: 45% win rate, average win $120, average loss $40 → consistently profitable
This is why your dashboard needs the risk/reward (R/R) ratio alongside win rate. R/R compares the average profit on winning trades to the average loss on losing trades. A ratio of 2:1 or higher generally indicates a healthy strategy, though this interacts with win rate.
The combination of win rate and risk/reward ratio is the fastest way to diagnose whether a bot's strategy is structurally sound — regardless of what the market did last week.
Display these metrics per bot or per strategy if you're running multiple configurations simultaneously.
How to Read Open Positions, Average Entry Price, and Exposure
A live positions panel is the real-time heartbeat of your dashboard. For each open trade, you want to see:
- Asset and side (e.g., BTC/USDT, long)
- Average entry price — especially critical for DCA bots that add to positions across multiple orders
- Current price and % change since entry
- Unrealized P&L in both base currency and percentage
- Exposure % — how much of total portfolio capital is tied up in this position
Exposure percentage is often overlooked. If a grid bot has 80% of your USDT locked into open BTC grid orders, a sudden 15% BTC drop creates outsized damage. Seeing exposure per asset and in aggregate helps you catch over-concentration before it becomes a problem.
How Do I Track My Crypto Trading Bot's Profit and Loss in Real Time?
Real-time P&L tracking requires a live connection to your exchange — typically via read-only API keys — and a polling or WebSocket feed that updates open positions and trade history continuously. Most dashboard frameworks poll exchange REST APIs every 5–30 seconds for balance and position data, while WebSocket streams deliver tick-level price updates for unrealized P&L calculations. The key is reconciling exchange trade history with your own records to avoid double-counting fees.
How Do I Calculate ROI for an Automated Crypto Trading Bot?
ROI for a trading bot is calculated as: (Total Realized P&L + Unrealized P&L – Fees) / Initial Capital × 100. For meaningful comparison across time periods, use annualized ROI: ROI × (365 / Days Active). Always subtract trading fees — for high-frequency bots running hundreds of trades per week, fees can silently consume 30–50% of gross profit. A complete dashboard should show gross P&L, total fees paid, and net P&L as separate line items.
Using Historical P&L Data to Match Bots to Market Conditions
Your historical P&L data is a strategy research tool, not just a record. By tagging trades with market regime — trending, ranging, or high-volatility — you can identify which bot types outperform in which conditions:
- Grid bots typically excel in ranging, sideways markets where price oscillates within a band. Historical data will show tighter, more frequent wins during low-volatility periods.
- DCA bots perform well in gradually declining or recovering markets, accumulating at lower prices and profiting on rebounds.
- Signal/indicator bots (RSI, MACD, Bollinger Bands) tend to shine in trending markets where momentum is sustained long enough for entries to play out.
A good dashboard lets you filter P&L by date range and overlay a price chart of the traded asset. When you visually align your equity curve with price action, patterns emerge that raw numbers alone obscure.
Can I Integrate a P&L Dashboard with Binance or Coinbase Trading Bots?
Yes — most P&L dashboards connect to exchanges like Binance, Coinbase Advanced, Kraken, and others via read-only API keys. Read-only keys expose trade history, balances, and open orders without granting withdrawal or order-placement permissions, which is the safest approach for a display-only dashboard. For bots running through a platform like Cryptohopper, an OAuth connection to your Cryptohopper account can expose unified trade history across multiple exchanges simultaneously, eliminating the need to manage separate API keys for each venue.
What Tools Are Used to Build a Crypto Trading Bot Performance Dashboard?
Common approaches include:
- Custom-coded dashboards using Python (with libraries like Pandas, Plotly, or Dash) or JavaScript frameworks (React, Next.js) — flexible but require significant development time.
- Grafana + InfluxDB — popular for time-series P&L data; powerful but needs infrastructure setup and a data pipeline.
- Spreadsheet-based trackers (Google Sheets + API scripts) — low barrier to entry but limited real-time capability and no live position feed.
- AI-generated custom dashboards — describe what you want in plain language, and a builder generates and deploys the code automatically.
Each approach has trade-offs between flexibility, development effort, and maintenance overhead.
Build Your Dashboard Faster with Cryptohopper.AI
If writing and deploying dashboard code isn't your priority, Cryptohopper.AI takes a different approach: you describe the P&L dashboard you want in plain language — "show me realized vs. unrealized gains by week, max drawdown, win rate per bot, and open position exposure" — and it generates and auto-deploys the app for you. Your project connects to your Cryptohopper account via OAuth, so trade history and position data flow in securely. Project secrets like API credentials are encrypted at rest and injected at runtime, never exposed in code or logs. The deployed dashboard runs at a free <your-project>.cryptohopper.app subdomain, with custom domain support if you need it.
It's built by the team behind Cryptohopper, the established automated trading platform — so the data model and exchange integrations are already understood.
Wrapping Up
A crypto trading bot P&L dashboard is not a vanity screen — it's a diagnostic instrument. Realized vs. unrealized gains tell you what you've actually earned. Maximum drawdown tells you what you risked to earn it. Win rate and risk/reward together reveal whether your strategy is structurally sound. And historical P&L filtered by market regime tells you where each bot type earns its edge. Build it right, read it consistently, and it becomes the clearest signal in your trading process.
Crypto trading involves substantial risk of loss. Past bot performance does not guarantee future results.
Frequently asked questions
What metrics should a crypto trading bot P&L dashboard display?
At minimum, a crypto trading bot P&L dashboard should display realized gains/losses, unrealized gains/losses, total return percentage, maximum drawdown, win rate, risk/reward ratio, average entry price per open position, and portfolio exposure percentage. Daily and weekly P&L breakdowns and a fees summary are also highly valuable.
How do I track my crypto trading bot's profit and loss in real time?
Real-time P&L tracking requires a live connection to your exchange via read-only API keys combined with either REST API polling (every 5–30 seconds) or WebSocket streams for live price data. The dashboard reconciles exchange trade history with position data to calculate both realized and floating unrealized P&L continuously.
How do I calculate ROI for an automated crypto trading bot?
ROI = (Total Realized P&L + Unrealized P&L – Fees) / Initial Capital × 100. For time-normalized comparison, use annualized ROI: ROI × (365 / Days Active). Always subtract trading fees separately, as high-frequency bots can lose 30–50% of gross profit to fees if left untracked.
Can I integrate a P&L dashboard with Binance or Coinbase trading bots?
Yes. Most P&L dashboards connect to Binance, Coinbase Advanced, Kraken, and other exchanges using read-only API keys, which expose trade history and balances without granting withdrawal permissions. If your bots run through Cryptohopper, an OAuth connection can provide unified trade history across multiple exchanges from a single integration.
What is the best dashboard for monitoring crypto trading bot performance?
The best dashboard is one that displays your key metrics — realized/unrealized P&L, drawdown, win rate, and position exposure — in real time and is connected directly to your exchange or trading platform. Cryptohopper.AI lets you describe and auto-deploy a custom dashboard in plain language, connected to your Cryptohopper account, without writing code yourself.
Subscribe to the Cryptohopper newsletter
New posts, product updates, and the occasional lesson — straight to your inbox.
We'll never share your email. Unsubscribe anytime.
Related articles

Crypto Trading Bot P&L Dashboard: Build and Read It Right
Learn what metrics your crypto trading bot P&L dashboard must display, how to calculate realized vs. unrealized profit and loss, and how to use time-segmented data to evaluate and tune bot performance over time.
RSI Crypto Trading Bot: A Practical Build Guide
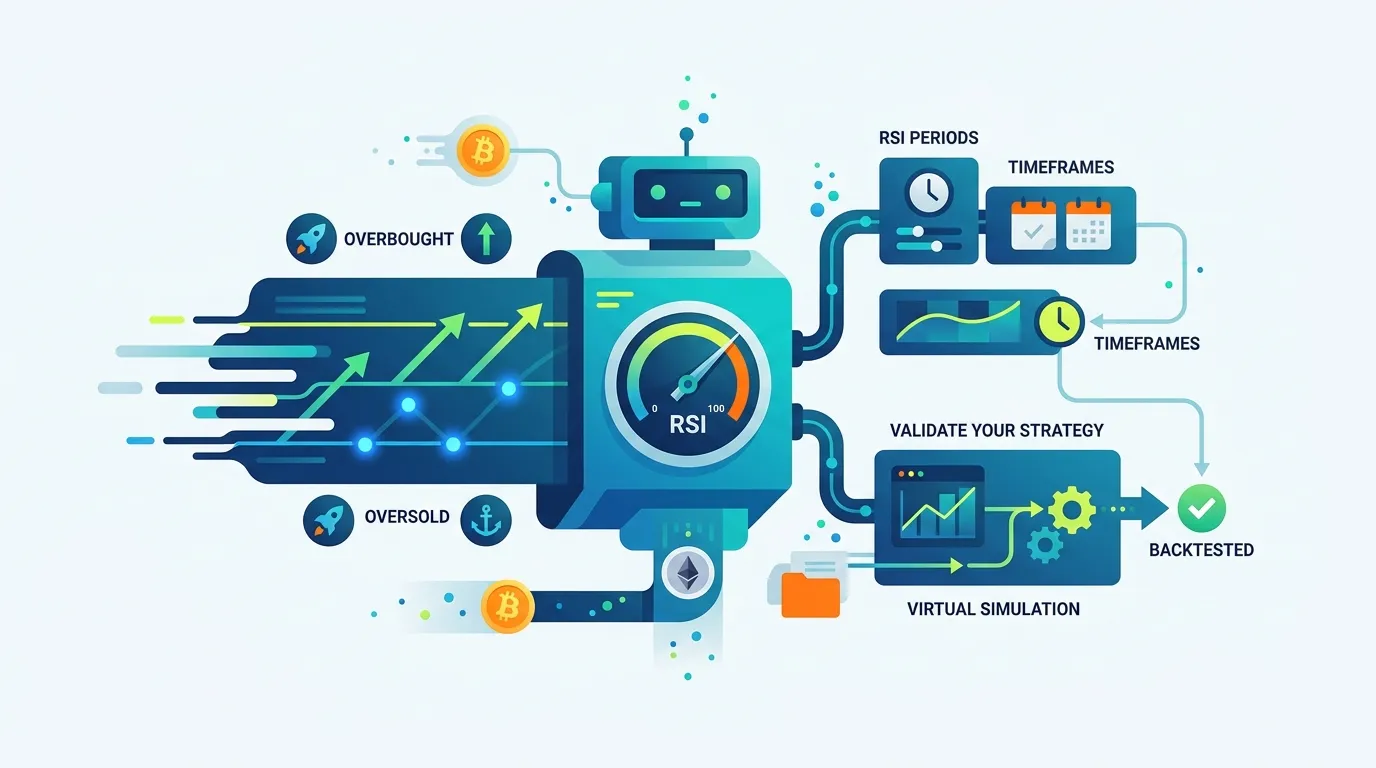
Learn how an RSI crypto trading bot detects overbought and oversold conditions, how to configure RSI periods and timeframes, and how to validate your strategy before going live.

How to Build a Crypto Stop-Loss Trailing Stop Bot That Protects Every Position
Learn how to build a crypto stop-loss trailing stop bot that automatically monitors multiple trading pairs, locks in gains, and limits downside without manual intervention.