Crypto P&L Dashboard: A Practical Building Guide for Real-Time Portfolio Tracking

Raw exchange interfaces tell you what just happened — they rarely tell you how you're doing. Position lists, order history tabs, and scattered CSV exports leave you manually stitching together a picture that should update itself. A purpose-built crypto P&L dashboard solves that problem by pulling everything into one live view so you can make informed decisions based on actual performance data.
This guide explains what a crypto P&L dashboard is, breaks down the metrics worth tracking, shows how P&L is calculated under the hood, and walks you through generating a fully functional real-time dashboard using plain language — no coding required.
What Is a Crypto P&L Dashboard?
A crypto P&L dashboard is a single-screen application that aggregates your trade history, open positions, and market prices to display profit and loss data in real time. It separates realized P&L (closed trades) from unrealized P&L (open positions still at risk), and layers on portfolio-level metrics like win rate, drawdown, and equity growth over time. Unlike a raw exchange UI, a dedicated dashboard normalizes data across trading pairs and time periods so you can evaluate performance — not just activity.
A good P&L dashboard doesn't just show your balance — it shows whether your strategy is working.
Exchange account pages are optimized for executing trades, not for performance analysis. They lack rolling statistics, visual equity curves, and the ability to compare performance across assets or time windows. A standalone dashboard fills that gap.
How Is P&L Calculated in Crypto Trading?
Understanding the math behind your numbers is essential before you build anything that displays them.
Realized P&L is calculated for a closed trade as:
Realized P&L = (Exit Price − Entry Price) × Quantity − Fees
Unrealized P&L applies the same formula but substitutes the current market price for the exit price — meaning it changes every second the position is open:
Unrealized P&L = (Current Price − Entry Price) × Quantity − Estimated Fees
Portfolio P&L aggregates both across all assets and adds a time dimension so you can see daily, weekly, or monthly performance. Fee deduction is critical: ignoring maker/taker fees routinely overstates gains, especially for high-frequency strategies. A well-built dashboard applies fee data pulled directly from trade history rather than estimating it.
Key Metrics Every Crypto P&L Dashboard Should Display
Not every number deserves screen space. Focus on metrics that reveal whether a strategy has an edge — not just whether you're up today.
- Open Position Value — Current market value of all open trades, updated in real time.
- Realized P&L (daily / weekly / all-time) — Total profit or loss on closed positions over a defined period.
- Unrealized P&L — Floating gain or loss across all open positions at the current market price.
- Win Rate — Percentage of closed trades that were profitable. Meaningful only alongside average gain vs. average loss.
- Average Trade Duration — How long positions are typically held. Helps identify whether short-term or swing-style entries dominate.
- Maximum Drawdown — The largest peak-to-trough decline in portfolio value. One of the most honest risk metrics available.
- Equity Curve — A time-series chart of cumulative portfolio value. Flat stretches and sharp drops are immediately visible in a way raw numbers hide.
Tracking win rate without tracking average gain-to-loss ratio is like measuring batting average without looking at slugging percentage — the context changes everything.
How Do I Track My Crypto Profits and Losses?
The most reliable way to track crypto profits and losses is to connect a dashboard directly to your exchange or trading platform via a read-only API or OAuth integration. Manual entry into spreadsheets introduces lag and human error; CSV imports fall out of date the moment you close the next trade. A live-connected dashboard pulls trade history and current prices automatically, recalculating P&L every time data updates — so the numbers you see reflect reality, not a snapshot from hours ago.
Can I Connect My Exchange to a Crypto P&L Dashboard?
Yes — and the connection method matters for both convenience and security. Most professional dashboards connect through exchange API keys (read-only permissions are sufficient for display purposes) or through an intermediary platform that already holds your trade data. When you build a dashboard through Cryptohopper.AI, the connection happens via Cryptohopper OAuth: your generated app requests permission from your Cryptohopper account, which already syncs with supported exchanges. Your credentials never appear in generated code or logs — they are encrypted at rest and injected securely at runtime.
Building a Live Crypto P&L Dashboard with Cryptohopper.AI
Cryptohopper.AI is an AI-powered builder where you describe the tool you want in plain language and the platform generates and deploys it automatically. Here's how a practical build session looks for a P&L dashboard.
Step 1 — Describe Your Dashboard in Plain Language
Start with a clear prompt. For example:
"Build a real-time crypto P&L dashboard that shows my open position values, realized P&L for the last 7 days, unrealized P&L, win rate, and maximum drawdown. Connect it to my Cryptohopper account."
The AI builder interprets this description, generates the underlying code, and deploys it instantly to a <your-project>.cryptohopper.app subdomain. No manual deploy step, no configuration files.
Step 2 — Authorize via Cryptohopper OAuth
Once the app is generated, you connect it to your Cryptohopper account through the built-in OAuth flow. This gives your dashboard secure, permissioned access to your trade history and position data — without exposing raw exchange API keys in the app itself.
Step 3 — Iterate with Follow-Up Prompts
Need an equity curve chart? Add a per-asset P&L breakdown table? Change the date range selector from 7 days to 30 days? Each refinement is a plain-language follow-up prompt. The builder updates the app continuously — there is no separate deployment step to trigger. If you want a custom domain, DNS validation and SSL are handled automatically by the platform.
Extending Your Dashboard: Charts and Visual Breakdowns
Static numbers tell you where you are. Charts tell you how you got there and whether the trend is improving or deteriorating.
Equity curve — A line chart of cumulative portfolio value over time is the single most informative visual a trader can have. Prompt the builder to add one: "Add an equity curve chart showing cumulative realized P&L over the past 90 days."
Per-asset P&L breakdown — A bar chart or table showing P&L by trading pair reveals which assets are carrying performance and which are dragging it. Useful for identifying strategy misfits in a multi-pair bot setup.
Drawdown chart — Visualizing drawdown over time alongside the equity curve shows how recovery periods relate to loss periods — critical context for evaluating risk-adjusted performance.
The AI builder's built-in AI Gateway also allows generated apps to call LLMs without you managing API keys separately, which means you can layer in features like natural-language performance summaries or anomaly alerts using simple follow-up prompts.
Do Crypto P&L Dashboards Support Tax Reporting?
Most P&L dashboards are built for performance analysis, not tax filing — and those are different tasks. Performance dashboards show running totals, rolling statistics, and equity curves. Tax reporting requires cost-basis calculation methods (FIFO, LIFO, HIFO), jurisdiction-specific rules, and formatted exports. A custom dashboard built with Cryptohopper.AI can display realized trade data in a structured format, but for formal tax reporting you should use purpose-built crypto tax software (such as Koinly or CoinTracker) that applies jurisdiction-specific accounting rules and generates compliant reports.
Best Practices for Reading Your P&L Dashboard
A dashboard is only as useful as your ability to interpret it correctly. Short-term P&L noise is real and misleading.
- Require a minimum sample size. Win rate calculated on 10 trades is statistically meaningless. Wait for at least 30–50 closed trades before drawing conclusions.
- Watch drawdown relative to expected gains. A 15% drawdown is very different in context for a strategy averaging 2% monthly gains versus one averaging 8%.
- Separate strategy performance from market conditions. A bot that profits in a trending market and loses in a ranging one isn't necessarily broken — but the dashboard should make that pattern visible.
- Focus on rolling metrics, not all-time totals. All-time realized P&L can look great while recent performance deteriorates. Always check 7-day and 30-day windows alongside lifetime numbers.
- Never conflate unrealized P&L with realized gains. Open positions can reverse. Treat unrealized P&L as information, not income.
What Is the Best App for Crypto Portfolio P&L Tracking?
The "best" app depends on your workflow. Dedicated tools like CoinStats or Delta offer pre-built portfolio tracking with manual and API-connected imports. For traders who want a dashboard tailored exactly to their strategy — specific metrics, custom layouts, integration with their own bot data — a generated tool built on Cryptohopper.AI can match requirements that off-the-shelf apps can't. The trade-off is setup time (described in plain language, not code) versus the limitations of a generic product.
Wrapping Up
A crypto P&L dashboard turns scattered exchange data into a coherent picture of strategy performance. By tracking realized and unrealized P&L, win rate, drawdown, and equity growth in one live view, you move from reacting to individual trades to understanding whether your approach has a measurable edge over time. If you want a dashboard built precisely around your metrics and connected to your existing Cryptohopper setup, Cryptohopper.AI lets you describe it in plain language and deploys it automatically — no code required, no manual steps. Trading crypto carries substantial risk of loss; a clear-eyed performance dashboard won't eliminate that risk, but it will make it visible.
Frequently asked questions
What is a crypto P&L dashboard?
A crypto P&L dashboard is a real-time application that aggregates your trade history, open positions, and live market prices to display profit and loss data in one place. It separates realized P&L (closed trades) from unrealized P&L (open positions), and adds portfolio-level metrics like win rate, drawdown, and cumulative equity growth — giving you a performance view that raw exchange interfaces don't provide.
How do I track my crypto profits and losses?
The most reliable method is to connect a dedicated dashboard directly to your exchange or trading platform via a read-only API or OAuth integration. This pulls trade history and current market prices automatically, recalculating P&L in real time. Manual spreadsheets and CSV imports fall out of date quickly and introduce human error, making live-connected dashboards the preferred approach for active traders.
How is P&L calculated in crypto trading?
Realized P&L is calculated as (Exit Price − Entry Price) × Quantity − Fees, applied to closed trades. Unrealized P&L uses the same formula but substitutes the current market price for the exit price, so it updates continuously while a position is open. Portfolio P&L aggregates both across all assets and time periods. Accurate fee deduction is essential — ignoring maker/taker fees consistently overstates gains.
Can I connect my exchange to a crypto P&L dashboard?
Yes. Most dashboards connect via read-only exchange API keys. When you build a dashboard with Cryptohopper.AI, the connection goes through Cryptohopper OAuth — your generated app requests permissioned access to your Cryptohopper account, which already syncs with supported exchanges. Your credentials are encrypted at rest and injected securely at runtime, and never appear in generated code or logs.
Do crypto P&L dashboards support tax reporting?
Most P&L dashboards are designed for performance analysis, not tax filing. Tax reporting requires cost-basis accounting methods (FIFO, LIFO, HIFO), jurisdiction-specific rules, and formatted export files — tasks handled by dedicated crypto tax software like Koinly or CoinTracker. A custom dashboard can display structured realized trade data, but formal tax compliance should be handled by purpose-built tax tools.
Subscribe to the Cryptohopper newsletter
New posts, product updates, and the occasional lesson — straight to your inbox.
We'll never share your email. Unsubscribe anytime.
Related articles

Build a Crypto Portfolio Dashboard: Real-Time P&L & Metrics
Learn how to build a crypto portfolio dashboard that tracks real-time P&L, asset allocation, and performance metrics — no coding required, deployed instantly with Cryptohopper.AI.
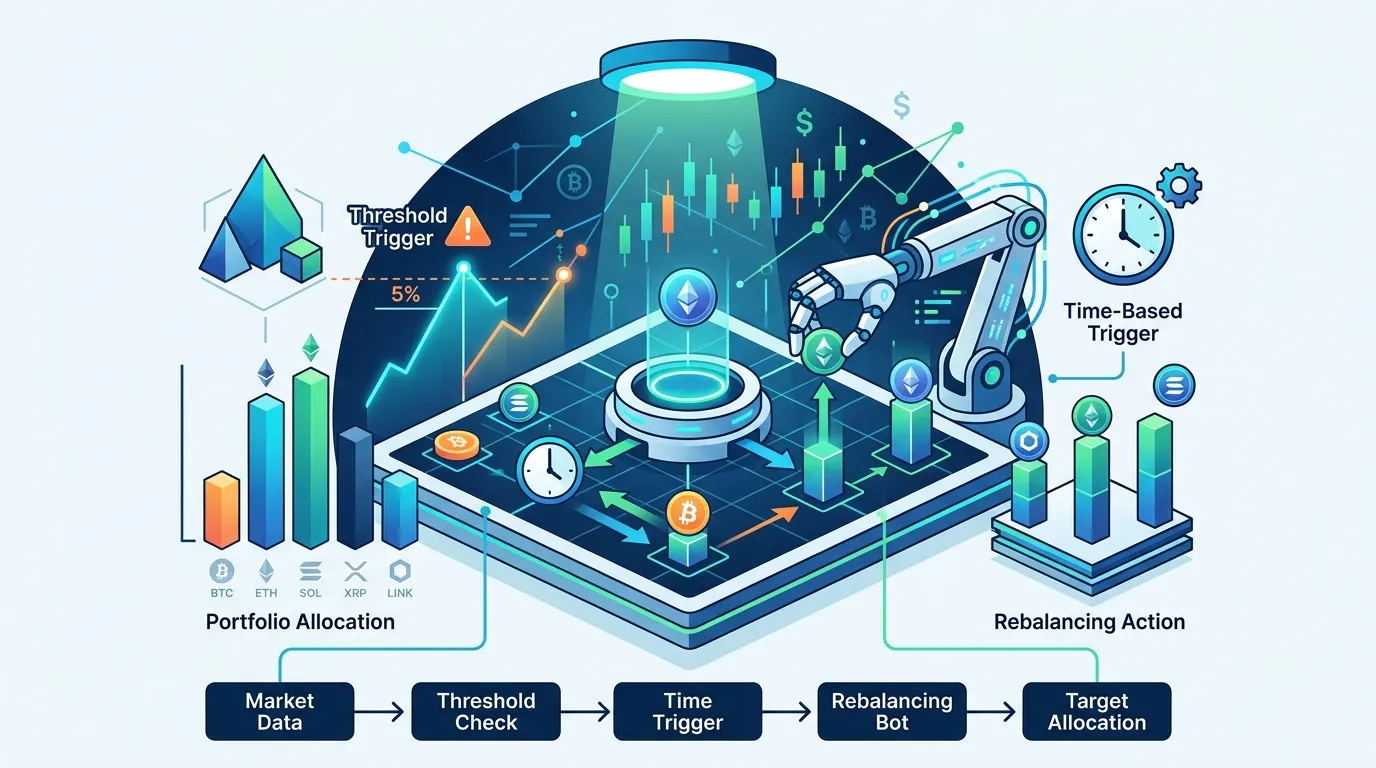
Crypto Portfolio Rebalancing Bot: A Complete Builder's Guide
Learn how to build a crypto portfolio rebalancing bot using threshold-based and time-based triggers to maintain target allocations automatically — without emotional bias or manual effort.
Crypto Grid Trading Bot: A Complete Setup Guide
Learn how a crypto grid trading bot works, how to configure price ranges and grid levels, and how to deploy one without writing a single line of code using an AI builder.