Crypto Trading Bot P&L Dashboard: Build and Read It Right

Running a crypto trading bot without a proper performance dashboard is like piloting a plane with your instruments covered. The raw balance number your exchange shows tells you almost nothing about why your equity is where it is, whether a drawdown is normal noise or a strategy failure, or which of your bots is actually earning its keep. A well-built crypto trading bot P&L dashboard cuts through that noise and gives you the signal you need to make informed decisions — and this guide shows you exactly how to build and read one.
What Metrics Should a Crypto Trading Bot P&L Dashboard Display?
A crypto trading bot P&L dashboard should display, at minimum: realized P&L, unrealized P&L, win rate, average trade duration, maximum drawdown, current drawdown, total fees paid, and equity curve over time. Secondary metrics include Sharpe ratio, profit factor, and per-strategy or per-pair breakdowns. Together, these metrics convert raw trade data into a diagnosis of bot health and strategy effectiveness.
Why a Dedicated P&L Dashboard Matters for Automated Trading
Exchange portfolio views are designed for manual traders — they show you spot balances, open orders, and sometimes a crude total value estimate. They are not designed to answer the questions that matter for an automated strategy:
- Is my bot's current losing streak statistically normal for this strategy, or has something broken?
- Which of my three bots generated the most risk-adjusted return last month?
- Am I losing more to fees than I'm gaining from signals?
A dedicated dashboard aggregates trade history across strategies and time periods, normalizes data, and presents it as answers rather than raw numbers. That distinction is the difference between monitoring and understanding.
"A balance chart shows you what happened. A P&L dashboard shows you why it happened and what to do next."
How Do I Calculate Realized vs. Unrealized P&L for a Crypto Trading Bot?
Realized P&L is the profit or loss locked in when a trade closes. The formula is straightforward:
Realized P&L = (Exit Price × Exit Quantity) − (Entry Price × Entry Quantity) − Fees
Unrealized P&L reflects the current value of any still-open position relative to its cost basis:
Unrealized P&L = (Current Market Price − Entry Price) × Quantity Held
Your dashboard should display both figures separately and combined. Combining them gives you a snapshot of total portfolio value, but keeping them distinct is critical: unrealized P&L can evaporate in minutes, while realized P&L is permanent. A bot that appears highly profitable may be sitting on large unrealized losses — separating the two exposes that risk immediately.
Always subtract trading fees from realized P&L calculations. On high-frequency bots, fee drag can silently erase a strategy's edge over weeks.
Core KPIs: What Are the Key Performance Indicators for Evaluating a Crypto Trading Bot?
Beyond basic P&L, these KPIs give you a complete picture of bot performance:
- Win Rate — Percentage of closed trades that ended in profit. A 60% win rate sounds healthy, but means little without the average win/loss ratio alongside it.
- Profit Factor — Total gross profit divided by total gross loss. A profit factor above 1.5 is generally considered solid; below 1.0 means the bot is losing money overall.
- Average Trade Duration — How long the bot holds positions on average. Sudden changes here often signal that market conditions have shifted away from the strategy's design parameters.
- Sharpe Ratio — Risk-adjusted return, calculated as
(Mean Return − Risk-Free Rate) / Standard Deviation of Return. Higher is better; below 1.0 suggests the returns don't justify the volatility. - Maximum Drawdown (Max DD) — The largest peak-to-trough equity decline in the measurement period. This is your worst historical scenario.
- Current Drawdown — The decline from the most recent equity peak to the current value. Unlike max DD, this is a live indicator.
- Total Fees Paid — Often overlooked, but especially important for grid and DCA bots that generate many small trades.
How to Calculate and Interpret Drawdown for Your Bot
Drawdown is where most traders misread their dashboards. The two figures serve entirely different purposes:
Maximum Drawdown
Max drawdown measures the deepest equity decline over a historical window:
Max Drawdown = (Peak Equity − Trough Equity) / Peak Equity × 100
A max drawdown of 18% means that at its worst, the strategy lost 18% of its peak value before recovering. This metric sets your historical risk baseline — if your bot's max DD has been 12% for six months and suddenly hits 25%, that's a diagnostic signal, not just noise.
Current Drawdown
Current drawdown measures the decline from the most recent equity high:
Current Drawdown = (Most Recent Peak − Current Equity) / Most Recent Peak × 100
Use current drawdown as a live circuit breaker. Many traders set a threshold — for example, pause the bot if current drawdown exceeds 1.5× its historical max DD — to prevent a strategy from running during a regime it was never designed for.
Max drawdown tells you what the bot has survived. Current drawdown tells you what it's surviving right now.
Tracking Performance by Strategy: DCA, Grid, and Signal Bots Side by Side
Running multiple bot types without per-strategy attribution is a common mistake. A $500 gain in your account might come entirely from your DCA bot while your grid bot is quietly losing — a blended view hides that split.
A well-structured dashboard segments P&L by:
- Strategy type (DCA, grid, RSI/signal-based)
- Trading pair (BTC/USDT, ETH/USDT, etc.)
- Time period (see the next section)
This breakdown lets you apply appropriate benchmarks to each bot type. Grid bots are designed to profit from range-bound markets and often underperform during strong trends — comparing them directly against a trend-following signal bot is misleading. Segment first, then evaluate.
Using Time-Segmented P&L to Spot Regime Changes
Daily, weekly, and monthly P&L views serve different analytical functions:
- Daily P&L is noisy but useful for catching sudden execution failures (e.g., an API disconnect or a misconfigured order size).
- Weekly P&L smooths intraday variance and reveals whether a bot is performing consistently or oscillating wildly.
- Monthly P&L exposes regime sensitivity. A bot that earned 4% in January, 3.8% in February, and then −2.1% in March is likely encountering a market condition it wasn't optimized for.
When monthly P&L flips negative after several positive months, that's the signal to pause the bot and investigate — not to let it run indefinitely hoping conditions revert. Time-segmented views give you that trigger before the drawdown becomes severe.
Can I Build a Real-Time P&L Dashboard for a Crypto Bot Using Python?
Yes — a Python-based P&L dashboard typically uses a combination of exchange API calls (via libraries like CCXT), a data store for trade history, and a visualization layer such as Plotly Dash or Streamlit. A minimal implementation would:
- Pull closed and open order history from the exchange API on a polling interval (e.g., every 60 seconds).
- Calculate realized P&L per trade using the formula above, net of fees.
- Compute running equity curve, win rate, and drawdown from the trade log.
- Render charts and KPI tiles in a browser-based UI.
The technical complexity escalates quickly once you add multi-exchange support, multi-bot attribution, and live WebSocket feeds for unrealized P&L. Maintaining that infrastructure is a real ongoing cost in time and effort.
For traders who want the analytics without the engineering overhead, Cryptohopper.AI offers a different path: describe the exact dashboard you need in plain language — "show me daily P&L by strategy, current drawdown, and win rate for each trading pair" — and the platform generates and auto-deploys a live-updating tool on a hosted subdomain. No manual coding, no server management. It connects to your Cryptohopper account via OAuth so the data pipeline is handled securely, with API secrets encrypted at rest and never exposed in generated code.
Wrapping Up
A crypto trading bot P&L dashboard is not a luxury — it's the minimum viable infrastructure for running automated strategies responsibly. Track realized and unrealized P&L separately, monitor drawdown as both a historical baseline and a live circuit breaker, segment results by strategy and time period, and use those KPIs together rather than in isolation. Whether you build your dashboard in Python or generate one with a tool like Cryptohopper.AI, the goal is the same: replace guesswork with a clear, data-driven picture of what your bots are actually doing. Crypto trading carries substantial risk of loss — robust performance visibility is how you stay informed and in control.
Frequently asked questions
What metrics should a crypto trading bot P&L dashboard display?
At minimum, your dashboard should show realized P&L, unrealized P&L, win rate, profit factor, average trade duration, maximum drawdown, current drawdown, total fees paid, and an equity curve over time. Per-strategy and per-pair breakdowns add another layer of diagnostic value.
How do I track profit and loss for an automated crypto trading bot?
Pull your closed and open order history from the exchange API, calculate realized P&L per trade as (exit value minus entry value minus fees), and track unrealized P&L as (current price minus entry price) times quantity held. Store this data in a time-series log so you can compute running equity, drawdown, and win rate over any period.
How do I calculate realized vs. unrealized P&L for a crypto trading bot?
Realized P&L = (Exit Price × Exit Quantity) − (Entry Price × Entry Quantity) − Fees. Unrealized P&L = (Current Market Price − Entry Price) × Quantity Held. Always separate the two: unrealized P&L can reverse instantly, while realized P&L is permanent. Summing them gives total portfolio value, but displaying them separately surfaces hidden open-position risk.
What is the best dashboard tool for monitoring crypto trading bot performance?
The right tool depends on your technical skill and time budget. Python with CCXT plus Plotly Dash or Streamlit is a popular self-built option. For a no-code route, Cryptohopper.AI (https://www.cryptohopper.ai) lets you describe the dashboard you want in plain language and auto-deploys a live-updating tool connected to your Cryptohopper account — no manual coding required.
What are the key performance indicators (KPIs) for evaluating a crypto trading bot?
The core KPIs are: realized and unrealized P&L, win rate, profit factor (gross profit divided by gross loss), average trade duration, Sharpe ratio, maximum drawdown, current drawdown, and total fees paid. For a complete picture, segment all of these by strategy type and trading pair rather than looking at blended totals only.
Subscribe to the Cryptohopper newsletter
New posts, product updates, and the occasional lesson — straight to your inbox.
We'll never share your email. Unsubscribe anytime.
Related articles

Crypto Trading Bot P&L Dashboard: Build and Read It Like a Pro
Learn what metrics your crypto trading bot P&L dashboard must track — from realized gains and drawdown to win rate and ROI — and how to interpret them to evaluate bot performance.
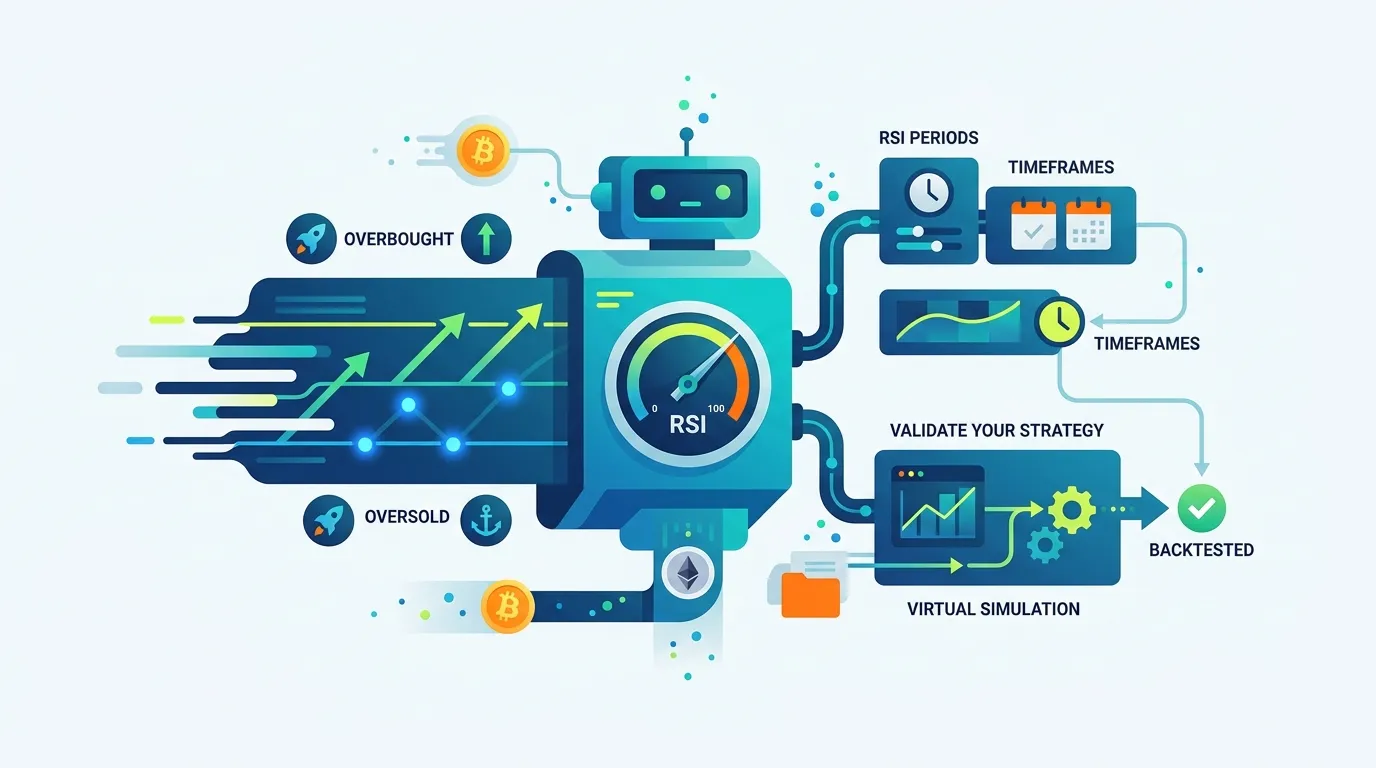
RSI Crypto Trading Bot: A Practical Build Guide
Learn how an RSI crypto trading bot detects overbought and oversold conditions, how to configure RSI periods and timeframes, and how to validate your strategy before going live.

How to Build a Crypto Stop-Loss Trailing Stop Bot That Protects Every Position
Learn how to build a crypto stop-loss trailing stop bot that automatically monitors multiple trading pairs, locks in gains, and limits downside without manual intervention.