Crypto Trading Bot Backtesting: A Step-by-Step Guide

You built a strategy that looks brilliant on a chart. RSI crosses, MACD confirms, Bollinger Bands squeeze — everything lines up. But how do you know it actually works before you wire real money to it? That is exactly what crypto trading bot backtesting is for, and this guide walks you through every step: what data you need, which metrics matter, and which mistakes will quietly destroy your results.
What Is Backtesting in Crypto Trading Bots?
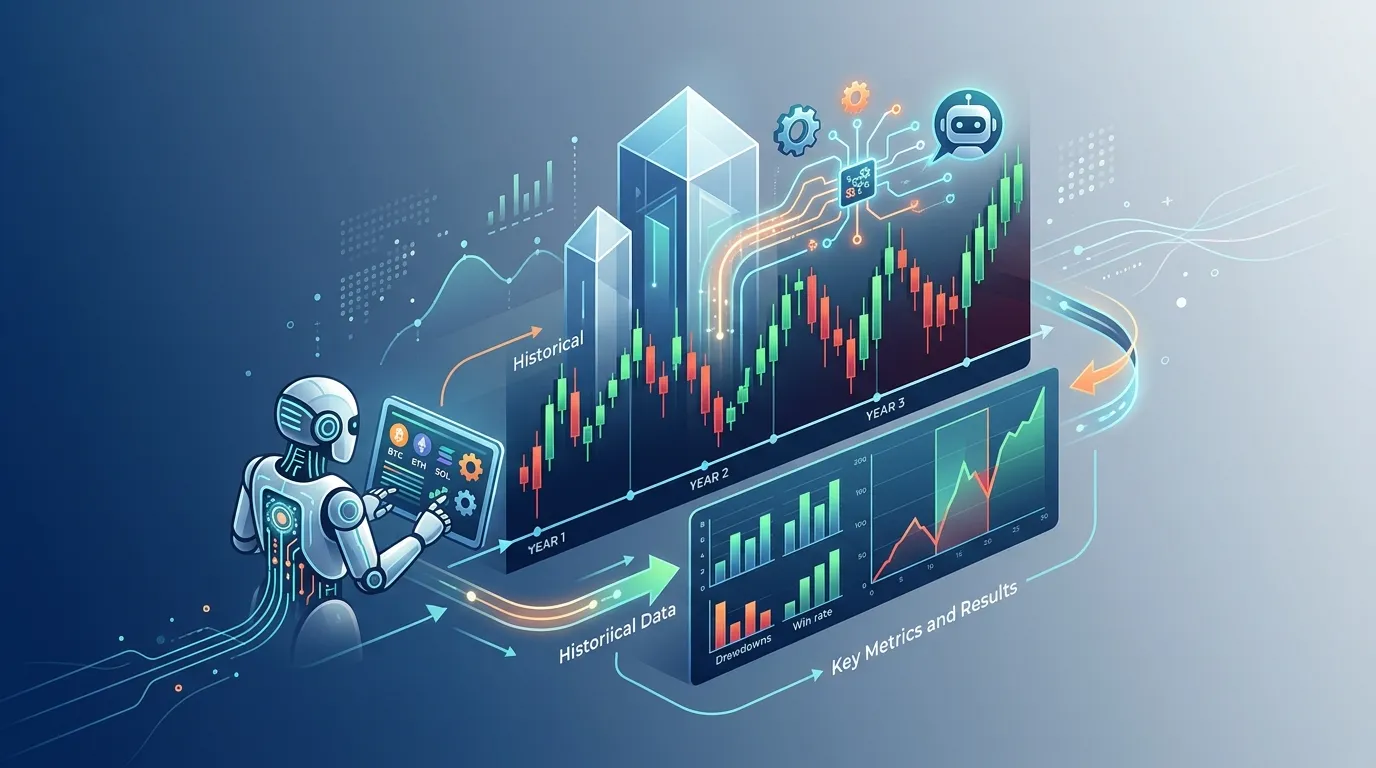
Crypto trading bot backtesting is the process of running a defined trading strategy against historical price data to simulate how it would have performed in the past. You feed the bot a set of rules — entry signals, exit conditions, position sizing — along with a dataset of historical candles, and the engine replays every bar, tallying hypothetical trades. The result is a performance report you can analyze before committing real capital.
Backtesting does not guarantee future results, but it is the most systematic way to disqualify strategies that clearly do not work — saving time, fees, and capital.
Key Inputs Every Backtest Needs
No backtest is better than the data and rules you put into it. Three inputs are non-negotiable.
1. Historical OHLCV Candle Data
OHLCV stands for Open, High, Low, Close, and Volume — the five fields that describe every candle on a price chart. You need:
- Timeframe: Match the candle interval (1m, 15m, 1h, 4h, 1D) to the strategy's intended holding period. A scalping strategy needs minute-level data; a swing strategy can use hourly or daily candles.
- Date range: Cover at least one full market cycle — ideally a bull run, a bear phase, and a sideways period. A dataset confined to a single trend type will flatter any trend-following strategy.
- Exchange source: Price data differs across venues. Use data from the exchange you plan to trade on so spreads and liquidity conditions are realistic.
Reliable historical data can be sourced from exchange APIs (Binance, Coinbase, Kraken all provide public endpoints) or aggregators such as CoinGecko.
2. Indicator Settings
Popular indicators and their configurable parameters include:
- RSI (Relative Strength Index): period length (default 14), overbought/oversold thresholds (e.g., 70/30).
- MACD: fast EMA period, slow EMA period, signal line period (classic: 12/26/9).
- Bollinger Bands: moving average period, standard deviation multiplier (default: 20-period SMA, ±2σ).
Document every parameter before running the test. Changing them after reviewing results is how overfitting starts.
3. Explicit Entry and Exit Rules
Ambiguity is the enemy of reproducible backtests. Define:
- Entry condition: e.g., "Buy when the 14-period RSI crosses above 30 on the 1-hour BTC/USDT chart."
- Exit condition: e.g., "Sell when RSI crosses above 70 or when price closes below the lower Bollinger Band."
- Position sizing: fixed dollar amount, fixed percentage of portfolio, or volatility-scaled.
- Stop-loss and take-profit levels: hard price levels or ATR multiples.
Common Backtesting Metrics and What They Reveal
Once the simulation runs, you will see a report. Here is how to read the four most important numbers.
| Metric | What It Measures | Healthy Range (rough guide) |
|---|---|---|
| Win Rate | % of trades that close in profit | >50% for low R:R strategies; lower win rates can be fine with high R:R |
| Profit Factor | Gross profit ÷ Gross loss | >1.5 is generally considered acceptable; >2.0 is strong |
| Max Drawdown | Largest peak-to-trough equity decline | Depends on risk tolerance; >30% is typically a red flag for retail bots |
| Sharpe Ratio | Risk-adjusted return vs. a risk-free baseline | >1.0 acceptable; >2.0 excellent |
No single metric tells the whole story. A 90% win rate is meaningless if the average loss is ten times the average win. Always read these metrics together.
How Accurate Is Crypto Trading Bot Backtesting?
Backtesting accuracy depends entirely on how faithfully the simulation models real market conditions. Three factors limit accuracy in practice:
- Slippage: In a backtest, your order fills at the exact candle close price. In live trading, market orders fill at the next available price, which can differ — sometimes significantly during volatile moments.
- Liquidity: Historical data does not capture order book depth. Large orders that would have moved the market in the past are simulated as if they filled instantly at the quoted price.
- Data quality: Gaps, duplicated candles, or incorrect OHLCV values corrupt results without any obvious error message.
A well-constructed backtest gives you a statistically grounded hypothesis, not a profit guarantee. The gap between backtest and live performance is often called "live slippage" or "execution drag," and it is real.
Pitfalls That Distort Backtest Results
Look-Ahead Bias
This occurs when your strategy inadvertently uses information that would not have been available at the time of the trade signal. A classic example: using the closing price of candle N to compute an indicator that triggers a buy at the open of the same candle N. The fix is strict time-alignment — signals must only use data from fully closed candles.
Overfitting / Curve-Fitting
If you tweak parameters until the backtest looks perfect on one dataset, you have not discovered a robust strategy — you have memorized past noise. Guard against this by:
- Splitting your data into an in-sample set (for tuning) and an out-of-sample set (for final validation).
- Using walk-forward optimization instead of static parameter searches.
- Keeping the number of free parameters small relative to the number of trades.
Ignoring Fees and Slippage
Every trade costs money. A maker fee of 0.1% and a taker fee of 0.1% means a round-trip costs at least 0.2% — before slippage. On a strategy that generates 200 trades per month, that is 40% in fees alone. Always model realistic fees for the exchange and order type you plan to use.
What Is the Difference Between Backtesting and Paper Trading in Crypto?
Backtesting replays a strategy against historical data in a compressed time window. You can test five years of price action in seconds. Paper trading (also called forward testing or simulation mode) runs the strategy against live market data in real time, but with simulated funds — no real money changes hands. Paper trading captures real spreads, real order book conditions, and real latency, which makes it the superior check on execution quality. Think of backtesting as passing a written exam and paper trading as a supervised driving lesson — both are necessary before going solo.
Building a Backtester with Cryptohopper.AI
If writing backtesting logic from scratch sounds daunting, Cryptohopper.AI lets you describe your strategy in plain language and generates the code automatically. You might type something like: "Build a backtester for a BTC/USDT RSI-14 mean-reversion strategy on hourly candles, including fee modeling at 0.1% per side and a max drawdown report." The platform generates the logic and auto-deploys it — no manual deploy step required. Generated projects are hosted on a cryptohopper.app subdomain and connect securely to your Cryptohopper account via OAuth so your API keys are never exposed in the code.
From Backtest to Paper Trading: The Final Validation Step
A strategy that survives a rigorous backtest — realistic fees, out-of-sample validation, no look-ahead bias — earns the right to move to paper trading. Run it in paper mode for at least two to four weeks across varying market conditions. Compare the live simulated metrics against the backtest projections. If the Sharpe ratio collapses or the drawdown doubles, investigate before touching live API keys. Only when paper trading results are broadly consistent with backtest expectations is it reasonable to consider moving to a live, exchange-connected bot.
Wrapping Up
Crypto trading bot backtesting is the essential first filter between an idea and a live strategy. Feed it clean OHLCV data, precise indicator rules, and realistic fee assumptions. Measure win rate, profit factor, max drawdown, and Sharpe ratio together. Avoid look-ahead bias and overfitting. Then validate in paper trading before you ever connect a live exchange key. Skipping any of these steps does not speed up the process — it just moves the learning cost from your backtest report to your trading account.
Frequently asked questions
What is backtesting in crypto trading bots?
Backtesting is the process of running a defined trading strategy against historical price data — typically OHLCV candle data — to simulate how the strategy would have performed in the past. The bot replays every historical bar, records hypothetical trades based on your entry and exit rules, and produces a performance report covering metrics like win rate, profit factor, and max drawdown. It lets you stress-test a strategy without risking real capital.
Which crypto trading bot has the best backtesting features?
The best backtesting setup depends on your technical needs, but the most capable tools share common features: tick-level or candle-level historical data access, realistic fee and slippage modeling, out-of-sample validation support, and clear metric reporting (win rate, Sharpe ratio, max drawdown). Cryptohopper (cryptohopper.com) offers built-in backtesting features for its bots, and Cryptohopper.AI (cryptohopper.ai) lets you generate custom backtester tools in plain language without writing code from scratch.
How accurate is crypto trading bot backtesting?
Backtesting accuracy is limited by three main factors: slippage (live orders rarely fill at the exact backtest price), liquidity assumptions (historical data does not capture order book depth), and data quality (gaps or errors in OHLCV data skew results). A well-constructed backtest — with realistic fees, no look-ahead bias, and out-of-sample validation — provides a statistically grounded estimate of strategy behavior, but it is not a guarantee of future performance.
What data do you need to backtest a crypto trading bot?
You need historical OHLCV (Open, High, Low, Close, Volume) candle data for the trading pair and timeframe your strategy targets. The dataset should cover at least one full market cycle — a bull phase, a bear phase, and a sideways period. You also need clearly defined indicator parameters (e.g., RSI period, MACD settings) and explicit entry/exit rules, plus realistic fee rates for the exchange you plan to use.
Can you backtest a trading bot for free?
Yes. Many crypto platforms and open-source libraries offer free backtesting capabilities. Cryptohopper (cryptohopper.com) includes backtesting in its subscription plans. Open-source Python libraries like Backtrader and Freqtrade are free to use and support custom strategy code. Cryptohopper.AI (cryptohopper.ai) lets you build a custom backtester tool using AI — an active Cryptohopper subscription is required to build and deploy, and every plan includes monthly AI Credits.
What is the difference between backtesting and paper trading in crypto?
Backtesting replays a strategy against historical data in compressed time — you can test years of price history in seconds, but the simulation cannot fully replicate real execution conditions. Paper trading runs the strategy against live market data in real time with simulated funds, capturing real spreads, real order book depth, and real latency. Backtesting is the first filter to eliminate clearly flawed strategies; paper trading is the second filter to validate execution quality before going live.
Subscribe to the Cryptohopper newsletter
New posts, product updates, and the occasional lesson — straight to your inbox.
We'll never share your email. Unsubscribe anytime.
Related articles

Backtesting a Crypto Trading Bot Strategy: A Practical Guide
Learn how to backtest a crypto trading bot strategy on historical candle data, interpret key metrics, avoid common pitfalls, and decide when your strategy is ready to go live.
Crypto Trading Bot Backtesting: A Complete Practical Guide
Learn how to backtest a crypto trading bot on historical candle data, interpret key metrics like Sharpe ratio and max drawdown, avoid common pitfalls, and refine your strategy before going live.

Crypto Trading Bot Backtesting: A Complete Practical Guide
Learn how to build a crypto trading bot backtesting tool, interpret Sharpe ratio, max drawdown, and win rate, and avoid the pitfalls that make results misleading before you go live.